
Palestine GDP, 1994–2025
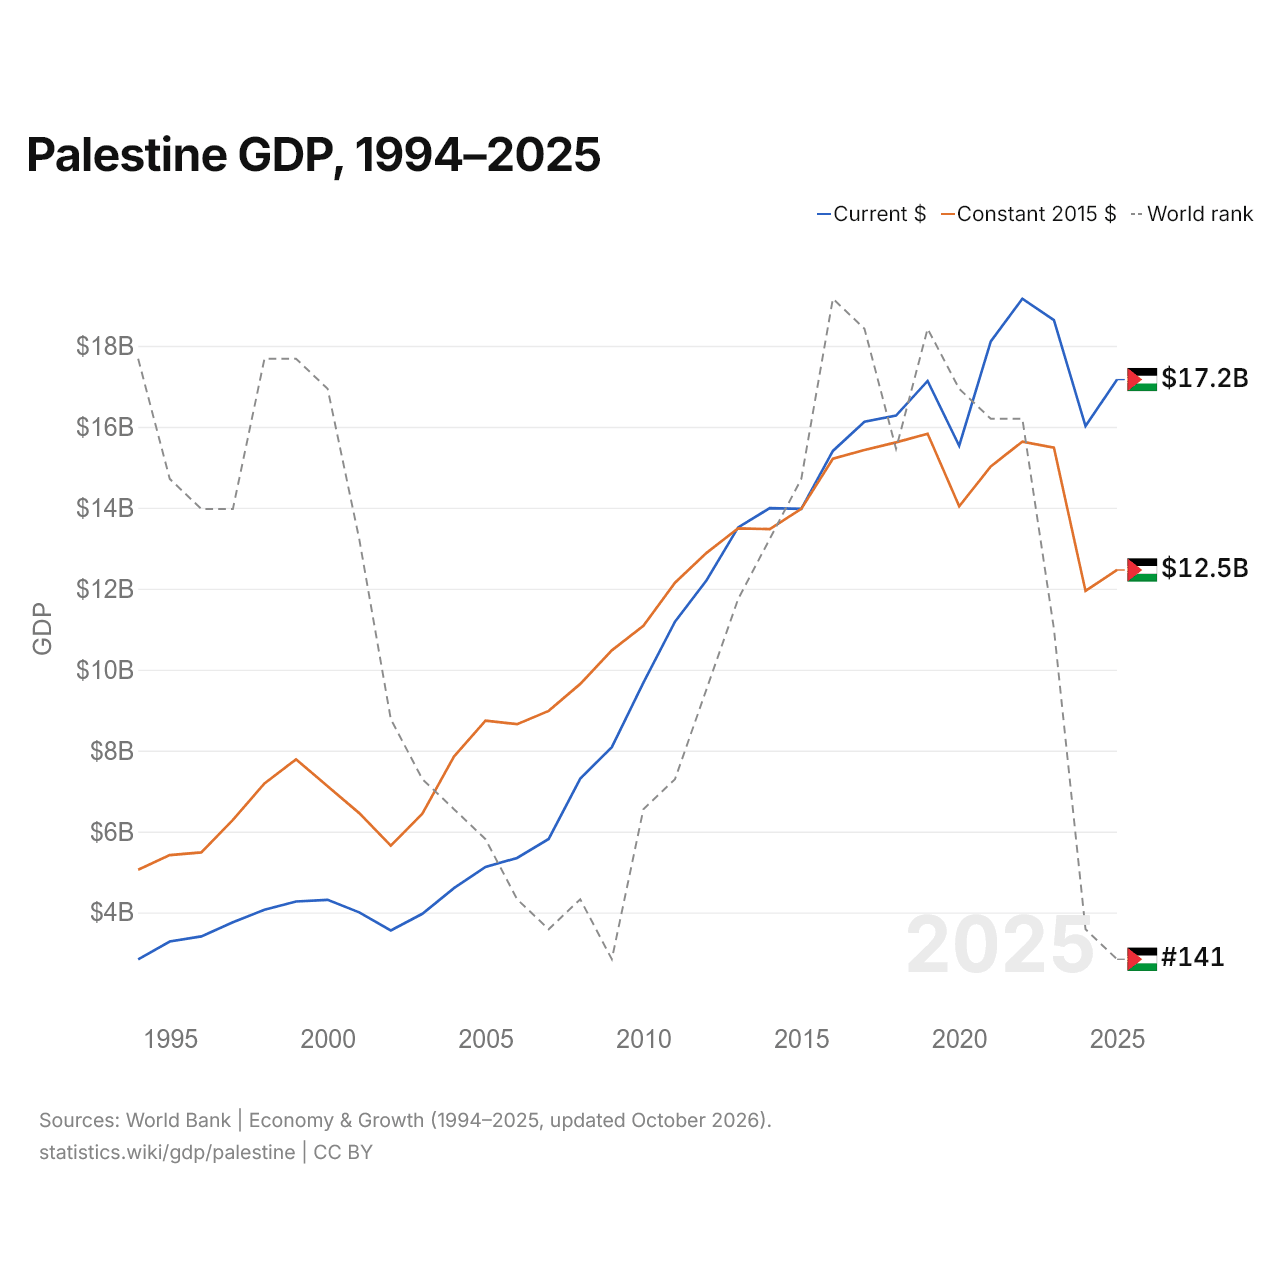
| Year | GDP | World rank | |
|---|---|---|---|
| Current $ | Constant 2015 $ | ||
| 2025 | $17,167,100,000 | $12,462,900,000 | #141 |
| 2024 | $16,016,900,000 | $11,944,000,000 | #140 |
| 2023 | $18,635,100,000 | $15,483,000,000 | #130 |
| 2022 | $19,165,500,000 | $15,635,000,000 | #123 |
| 2021 | $18,109,000,000 | $15,021,700,000 | #123 |
| 2020 | $15,531,700,000 | $14,037,400,000 | #122 |
| 2019 | $17,133,500,000 | $15,829,000,000 | #120 |
| 2018 | $16,276,600,000 | $15,616,200,000 | #124 |
| 2017 | $16,128,000,000 | $15,426,900,000 | #120 |
| 2016 | $15,405,400,000 | $15,211,000,000 | #119 |
| 2015 | $13,972,400,000 | $13,972,400,000 | #125 |
| 2014 | $13,989,700,000 | $13,471,100,000 | #127 |
| 2013 | $13,515,500,000 | $13,492,400,000 | #129 |
| 2012 | $12,208,400,000 | $12,886,900,000 | #132 |
| 2011 | $11,186,100,000 | $12,146,400,000 | #135 |
| 2010 | $9,681,500,000 | $11,082,400,000 | #136 |
| 2009 | $8,085,700,000 | $10,477,100,000 | #141 |
| 2008 | $7,310,400,000 | $9,648,000,000 | #139 |
| 2007 | $5,815,700,000 | $8,980,800,000 | #140 |
| 2006 | $5,348,300,000 | $8,653,000,000 | #139 |
| 2005 | $5,125,700,000 | $8,740,100,000 | #137 |
| 2004 | $4,603,100,000 | $7,853,400,000 | #136 |
| 2003 | $3,968,000,000 | $6,441,200,000 | #135 |
| 2002 | $3,555,800,000 | $5,649,400,000 | #133 |
| 2001 | $4,003,700,000 | $6,455,600,000 | #127 |
| 2000 | $4,313,600,000 | $7,118,400,000 | #122 |
| 1999 | $4,271,200,000 | $7,784,400,000 | #121 |
| 1998 | $4,067,800,000 | $7,189,100,000 | #121 |
| 1997 | $3,759,800,000 | $6,287,800,000 | #126 |
| 1996 | $3,409,600,000 | $5,483,500,000 | #126 |
| 1995 | $3,282,800,000 | $5,417,700,000 | #125 |
| 1994 | $2,843,300,000 | $5,057,700,000 | #121 |
Palestine's GDP was $17.2 billion in 2025, or 0.015% of world GDP. It was the 141st largest in the world, down from 140th in 2024. Its highest rank was 119th, last held in 2016. In constant 2015 dollars, GDP grew 4.3% in 2025 but fell 10.8% over the ten years since 2015.
In constant 2015 dollars, Palestine's GDP was 2.5 times as large in 2025 as in 1994, an average growth of 3.0% a year.
Palestine's GDP was the 44th largest of the 48 countries of Asia, and 0.041% of the region's total. Its GDP per capita was $3,171 in 2025, the 141st highest in the world. At purchasing power parity, its GDP (PPP) was $27.1 billion in 2025, the 152nd largest in the world.
Palestine in the world GDP ranking, 2025
| Rank | Country | GDP | Share of world | |
|---|---|---|---|---|
| 138 |
 Laos |
$18.3B | 0.02% | |
| 139 |
 Afghanistan |
$17.8B (2024) | 0.02% | |
| 140 |
 Tajikistan |
$17.7B | 0.01% | |
| 141 |
 Palestine |
$17.2B | 0.01% | |
| 142 |
 Rwanda |
$16.4B | 0.01% | |
| 143 |
 Congo |
$16.3B | 0.01% | |
| 144 |
 Mauritius |
$16.2B | 0.01% |
Compare Palestine GDP with other countries
Sources:
- World Bank | Economy & Growth (1994–2025, updated October 2026)
Creative Commons Attribution (CC BY): you may copy, share, adapt and reuse this content, also commercially, as long as you credit statistics.wiki and note any changes you made. The sources listed above may have their own license terms.