
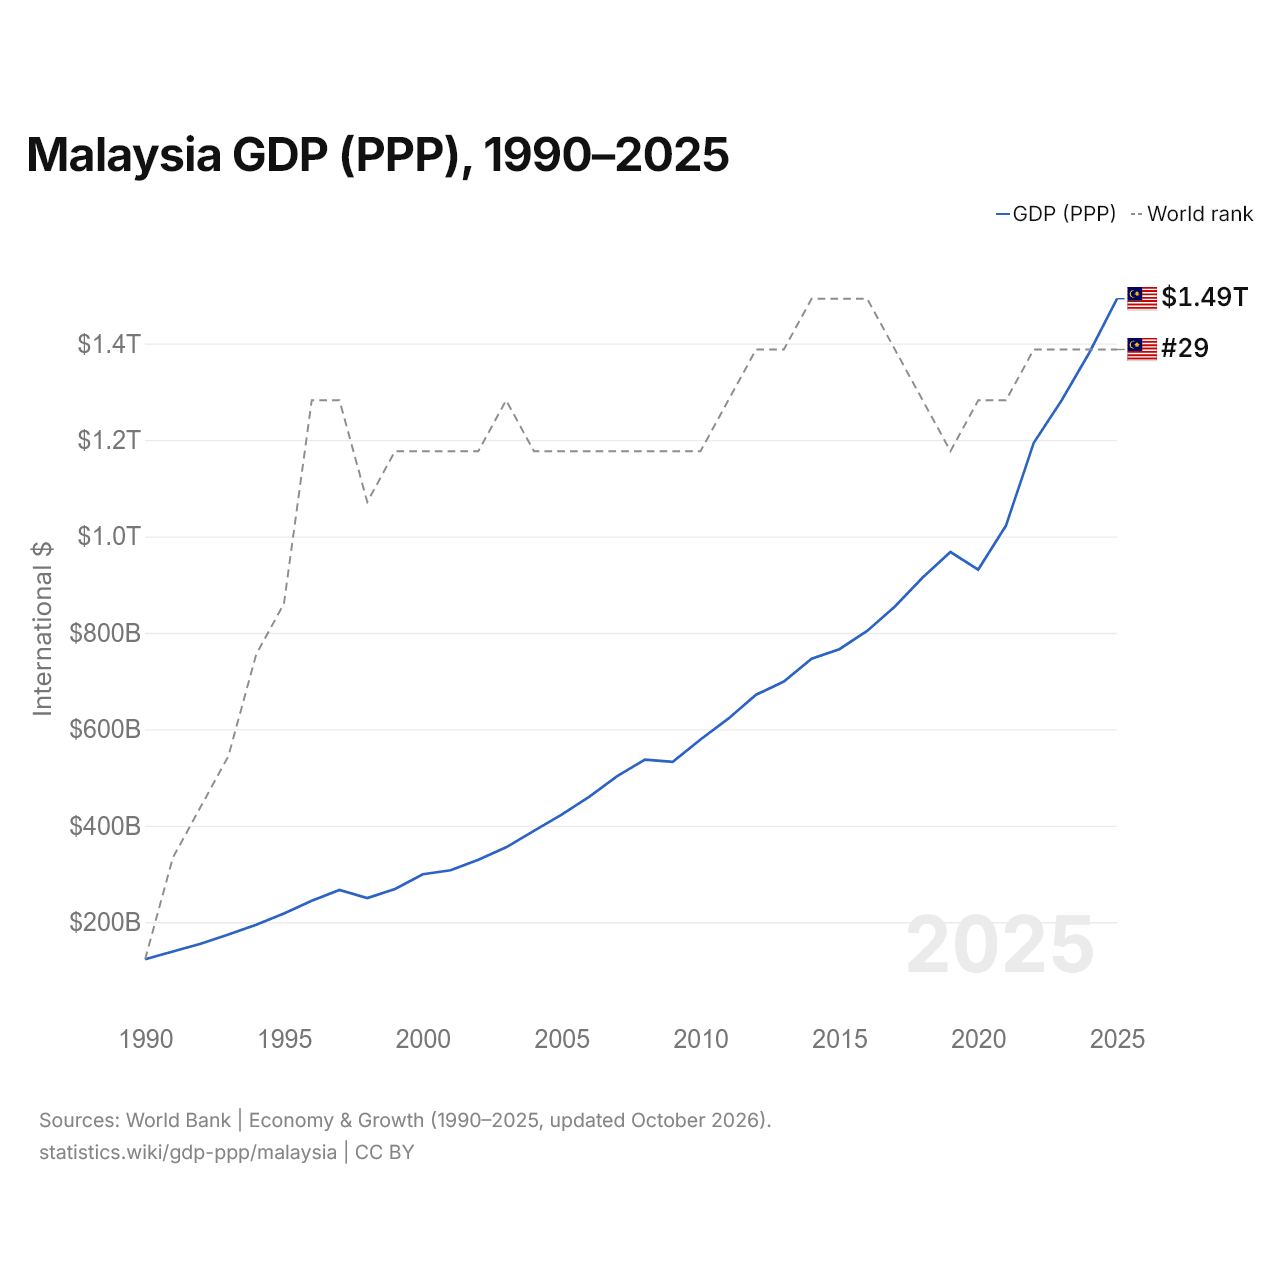
Malaysia GDP (PPP), 1990–2025
1x
| Year | International $ | World rank |
|---|---|---|
| GDP (PPP) | ||
| 2025 | $1,492,996,614,458 | #29 |
| 2024 | $1,380,903,612,305 | #29 |
| 2023 | $1,282,002,684,292 | #29 |
| 2022 | $1,194,025,047,009 | #29 |
| 2021 | $1,022,398,815,014 | #30 |
| 2020 | $931,106,663,877 | #30 |
| 2019 | $967,567,806,881 | #31 |
| 2018 | $914,713,180,247 | #30 |
| 2017 | $854,693,620,882 | #29 |
| 2016 | $803,828,295,814 | #28 |
| 2015 | $766,027,917,953 | #28 |
| 2014 | $746,116,305,787 | #28 |
| 2013 | $698,862,906,455 | #29 |
| 2012 | $671,523,206,705 | #29 |
| 2011 | $621,861,803,379 | #30 |
| 2010 | $578,657,813,402 | #31 |
| 2009 | $532,195,216,545 | #31 |
| 2008 | $537,061,439,765 | #31 |
| 2007 | $502,623,799,375 | #31 |
| 2006 | $460,368,023,537 | #31 |
| 2005 | $422,973,326,617 | #31 |
| 2004 | $389,353,505,935 | #31 |
| 2003 | $355,071,566,643 | #30 |
| 2002 | $329,144,531,978 | #31 |
| 2001 | $307,529,056,857 | #31 |
| 2000 | $299,208,017,014 | #31 |
| 1999 | $268,770,475,586 | #31 |
| 1998 | $249,694,877,223 | #32 |
| 1997 | $266,535,267,080 | #30 |
| 1996 | $244,139,235,637 | #30 |
| 1995 | $217,949,174,451 | #34 |
| 1994 | $194,368,644,593 | #35 |
| 1993 | $174,252,991,500 | #37 |
| 1992 | $154,891,808,950 | #38 |
| 1991 | $139,083,006,807 | #39 |
| 1990 | $122,810,506,139 | #41 |
In 2025, Malaysia's GDP (PPP) was $1.49 trillion, up from $123 billion in 1990. Malaysia's was 0.71% of world GDP (PPP). It was the 29th largest in the world, a rank it has held since 2022. Its highest rank was 28th, last held in 2016.
Malaysia's share of world GDP (PPP) rose from 0.41% in 1990 to its highest in 2025. Malaysia's price level was 32 in 2025 (United States = 100), the 156th highest in the world.
Malaysia in the world GDP (PPP) ranking, 2025
| Rank | Country | GDP (PPP) | Share of world | |
|---|---|---|---|---|
| 26 |
 Pakistan |
$1.68T | 0.79% | vs Pakistan |
| 27 |
 Netherlands |
$1.58T | 0.75% | vs Netherlands |
| 28 |
 Argentina |
$1.49T | 0.71% | vs Argentina |
| 29 |
 Malaysia |
$1.49T | 0.71% | |
| 30 |
 Philippines |
$1.47T | 0.7% | vs Philippines |
| 31 |
 Colombia |
$1.21T | 0.57% | |
| 32 |
 Taiwan |
$1.19T (2017) | 0.95% | vs Taiwan |
Compare Malaysia GDP (PPP) with other countries
Sources:
- World Bank | Economy & Growth (1990–2025, updated October 2026)
- Central Intelligence Agency (CIA) (2017, updated October 2026)
Creative Commons Attribution (CC BY): you may copy, share, adapt and reuse this content, also commercially, as long as you credit statistics.wiki and note any changes you made. The sources listed above may have their own license terms.