
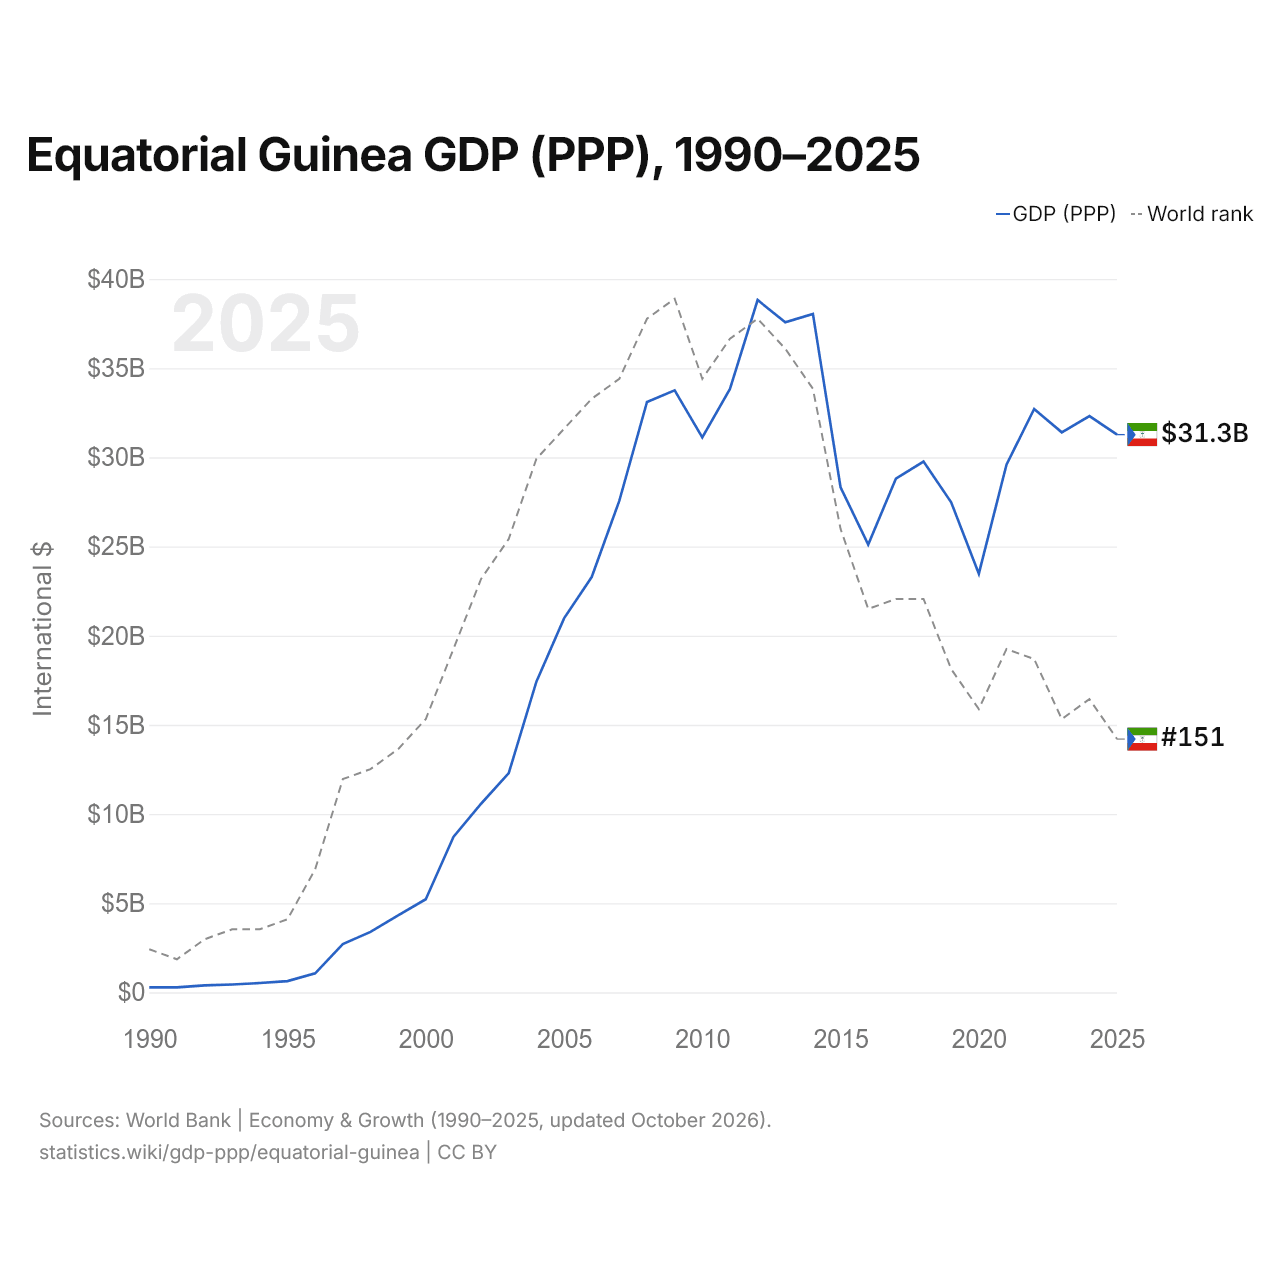
Equatorial Guinea GDP (PPP), 1990–2025
| Year | International $ | World rank |
|---|---|---|
| GDP (PPP) | ||
| 2025 | $31,272,912,049 | #151 |
| 2024 | $32,309,841,979 | #147 |
| 2023 | $31,402,794,079 | #149 |
| 2022 | $32,711,102,161 | #143 |
| 2021 | $29,585,328,380 | #142 |
| 2020 | $23,476,322,656 | #148 |
| 2019 | $27,476,690,018 | #144 |
| 2018 | $29,763,387,484 | #137 |
| 2017 | $28,802,412,248 | #137 |
| 2016 | $25,110,506,259 | #138 |
| 2015 | $28,320,531,412 | #130 |
| 2014 | $38,043,505,840 | #116 |
| 2013 | $37,572,294,948 | #112 |
| 2012 | $38,819,917,942 | #109 |
| 2011 | $33,829,572,382 | #111 |
| 2010 | $31,115,770,392 | #115 |
| 2009 | $33,754,473,546 | #107 |
| 2008 | $33,102,869,198 | #109 |
| 2007 | $27,569,927,683 | #115 |
| 2006 | $23,284,349,080 | #117 |
| 2005 | $20,971,910,438 | #120 |
| 2004 | $17,417,184,474 | #123 |
| 2003 | $12,290,755,429 | #131 |
| 2002 | $10,576,779,293 | #135 |
| 2001 | $8,718,135,555 | #142 |
| 2000 | $5,218,606,640 | #149 |
| 1999 | $4,316,766,986 | #152 |
| 1998 | $3,387,232,896 | #154 |
| 1997 | $2,706,202,413 | #155 |
| 1996 | $1,064,245,681 | #164 |
| 1995 | $627,393,538 | #169 |
| 1994 | $523,047,695 | #170 |
| 1993 | $438,945,896 | #170 |
| 1992 | $386,174,865 | #171 |
| 1991 | $280,210,535 | #173 |
| 1990 | $273,843,663 | #172 |
In 2025, Equatorial Guinea's GDP (PPP) was $31.3 billion, up from $274 million in 1990. Equatorial Guinea's was 0.015% of world GDP (PPP). It was highest in 2012, at $38.8 billion. It was the 151st largest in the world, down from 147th in 2024. Its highest rank was 107th, last held in 2009.
Equatorial Guinea's share of world GDP (PPP) was less than 0.01% in 1990 and peaked at 0.040% in 2009. Equatorial Guinea's price level was 41 in 2025 (United States = 100), the 107th highest in the world.
Equatorial Guinea in the world GDP (PPP) ranking, 2025
| Rank | Country | GDP (PPP) | Share of world | |
|---|---|---|---|---|
| 148 |
 Sierra Leone |
$32.8B | 0.02% | |
| 149 |
 Iceland |
$32.7B | 0.02% | |
| 150 |
 Somalia |
$32.3B | 0.02% | |
| 151 |
 Equatorial Guinea |
$31.3B | 0.01% | |
| 152 |
 Palestine |
$27.1B | 0.01% | |
| 153 |
 Montenegro |
$22.1B | 0.01% | |
| 154 |
 Burundi |
$18.0B | 0.009% |
Compare Equatorial Guinea GDP (PPP) with other countries
Sources:
- World Bank | Economy & Growth (1990–2025, updated October 2026)
Creative Commons Attribution (CC BY): you may copy, share, adapt and reuse this content, also commercially, as long as you credit statistics.wiki and note any changes you made. The sources listed above may have their own license terms.