
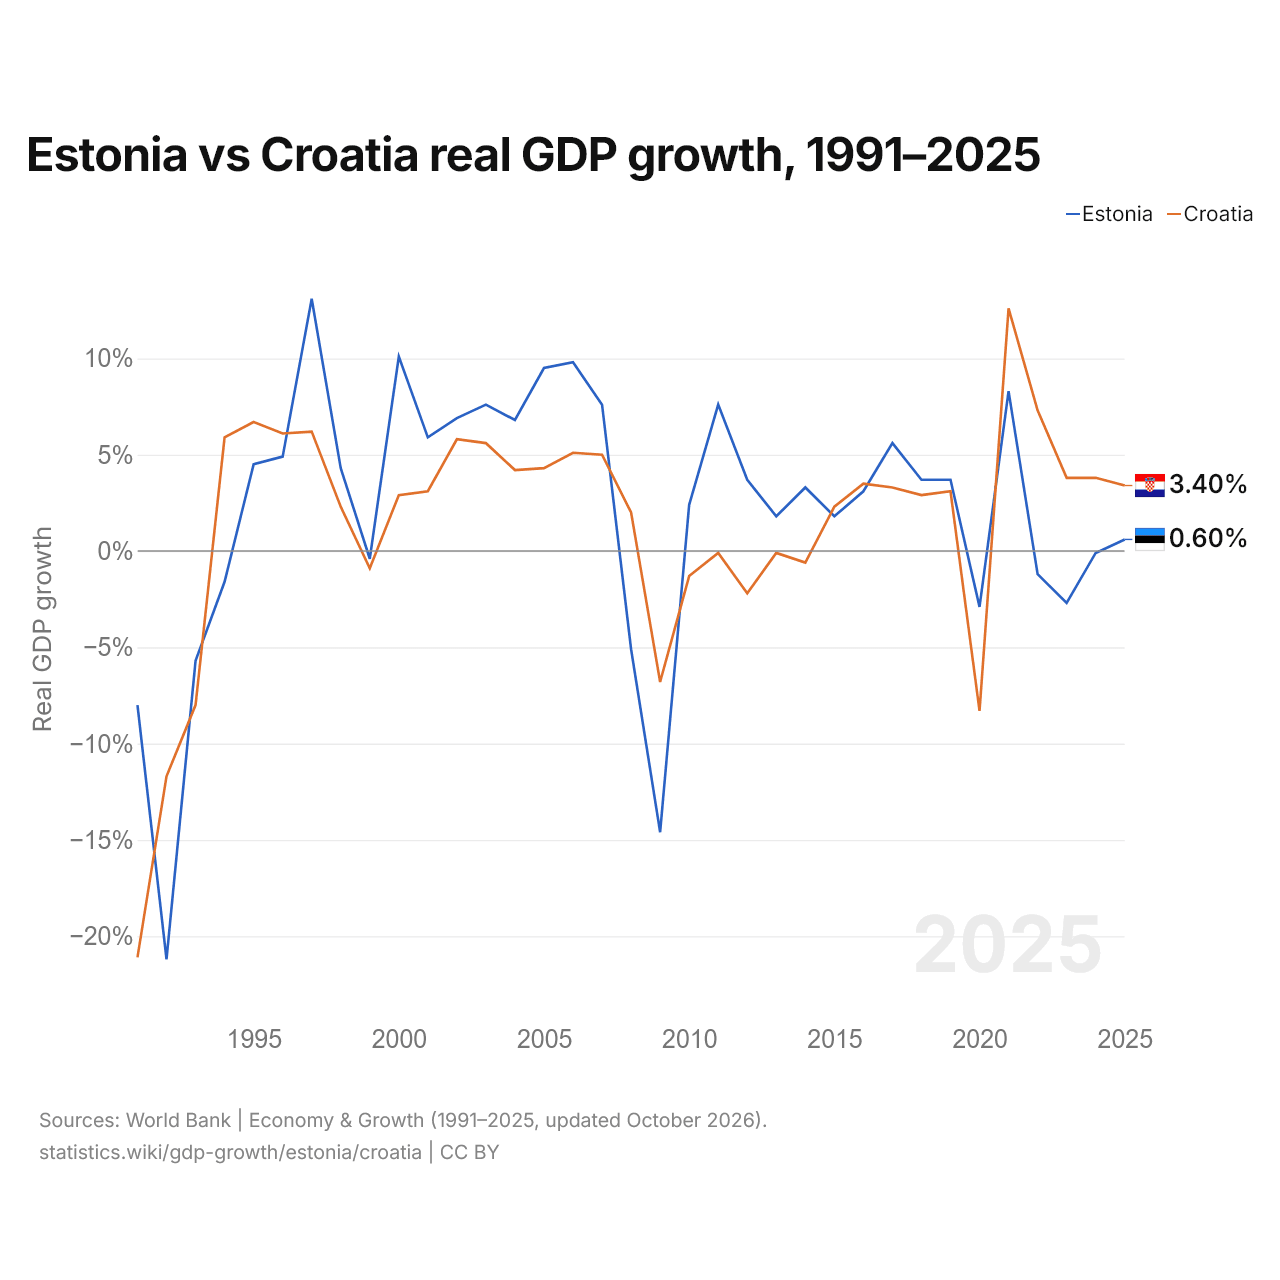
Estonia vs Croatia real GDP growth, 1991–2025
1x
| Year | Real GDP growth | |
|---|---|---|
 Estonia |
 Croatia |
|
| 2025 | 0.6% | 3.4% |
| 2024 | −0.1% | 3.8% |
| 2023 | −2.7% | 3.8% |
| 2022 | −1.2% | 7.3% |
| 2021 | 8.3% | 12.6% |
| 2020 | −2.9% | −8.3% |
| 2019 | 3.7% | 3.1% |
| 2018 | 3.7% | 2.9% |
| 2017 | 5.6% | 3.3% |
| 2016 | 3.1% | 3.5% |
| 2015 | 1.8% | 2.3% |
| 2014 | 3.3% | −0.6% |
| 2013 | 1.8% | −0.1% |
| 2012 | 3.7% | −2.2% |
| 2011 | 7.6% | −0.1% |
| 2010 | 2.4% | −1.3% |
| 2009 | −14.6% | −6.8% |
| 2008 | −5.1% | 2% |
| 2007 | 7.6% | 5% |
| 2006 | 9.8% | 5.1% |
| 2005 | 9.5% | 4.3% |
| 2004 | 6.8% | 4.2% |
| 2003 | 7.6% | 5.6% |
| 2002 | 6.9% | 5.8% |
| 2001 | 5.9% | 3.1% |
| 2000 | 10.1% | 2.9% |
| 1999 | −0.4% | −0.9% |
| 1998 | 4.3% | 2.3% |
| 1997 | 13.1% | 6.2% |
| 1996 | 4.9% | 6.1% |
| 1995 | 4.5% | 6.7% |
| 1994 | −1.6% | 5.9% |
| 1993 | −5.7% | −8% |
| 1992 | −21.2% | −11.7% |
| 1991 | −8% | −21.1% |
In 2025, real GDP growth was 0.6% in Estonia and 3.4% in Croatia: 2.8 percentage points higher in Croatia. From 2015 to 2025, the average yearly growth was 1.7% in Estonia and 3.4% in Croatia.
Estonia's real GDP growth was higher than Croatia's in 22 of the years from 1991 to 2025, and lower in 13. Real GDP shrank in both Estonia and Croatia in six of those years, most recently in 2020.
Estonia vs Croatia: GDP growth figures
|
Estonia
|
Croatia
|
|
|---|---|---|
| Growth, 2025 | +0.6% | +3.4% |
| World rank | 170/191 | 94/191 |
| Average yearly growth, 2020–2025 | +0.9% | +6.1% |
| Average yearly growth, 2015–2025 | +1.7% | +3.4% |
| Average yearly growth, 2005–2025 | +1.7% | +1.8% |
| Years of negative growth, 1991–2025 | 11 | 11 |
| Best year, 1991–2025 | 1997: +13.1% | 2021: +12.6% |
| Worst year, 1991–2025 | 1992: −21.2% | 1991: −21.1% |
Compare the GDP growth of any 2 countries
Sources:
- World Bank | Economy & Growth (1991–2025, updated October 2026)
Creative Commons Attribution (CC BY): you may copy, share, adapt and reuse this content, also commercially, as long as you credit statistics.wiki and note any changes you made. The sources listed above may have their own license terms.