
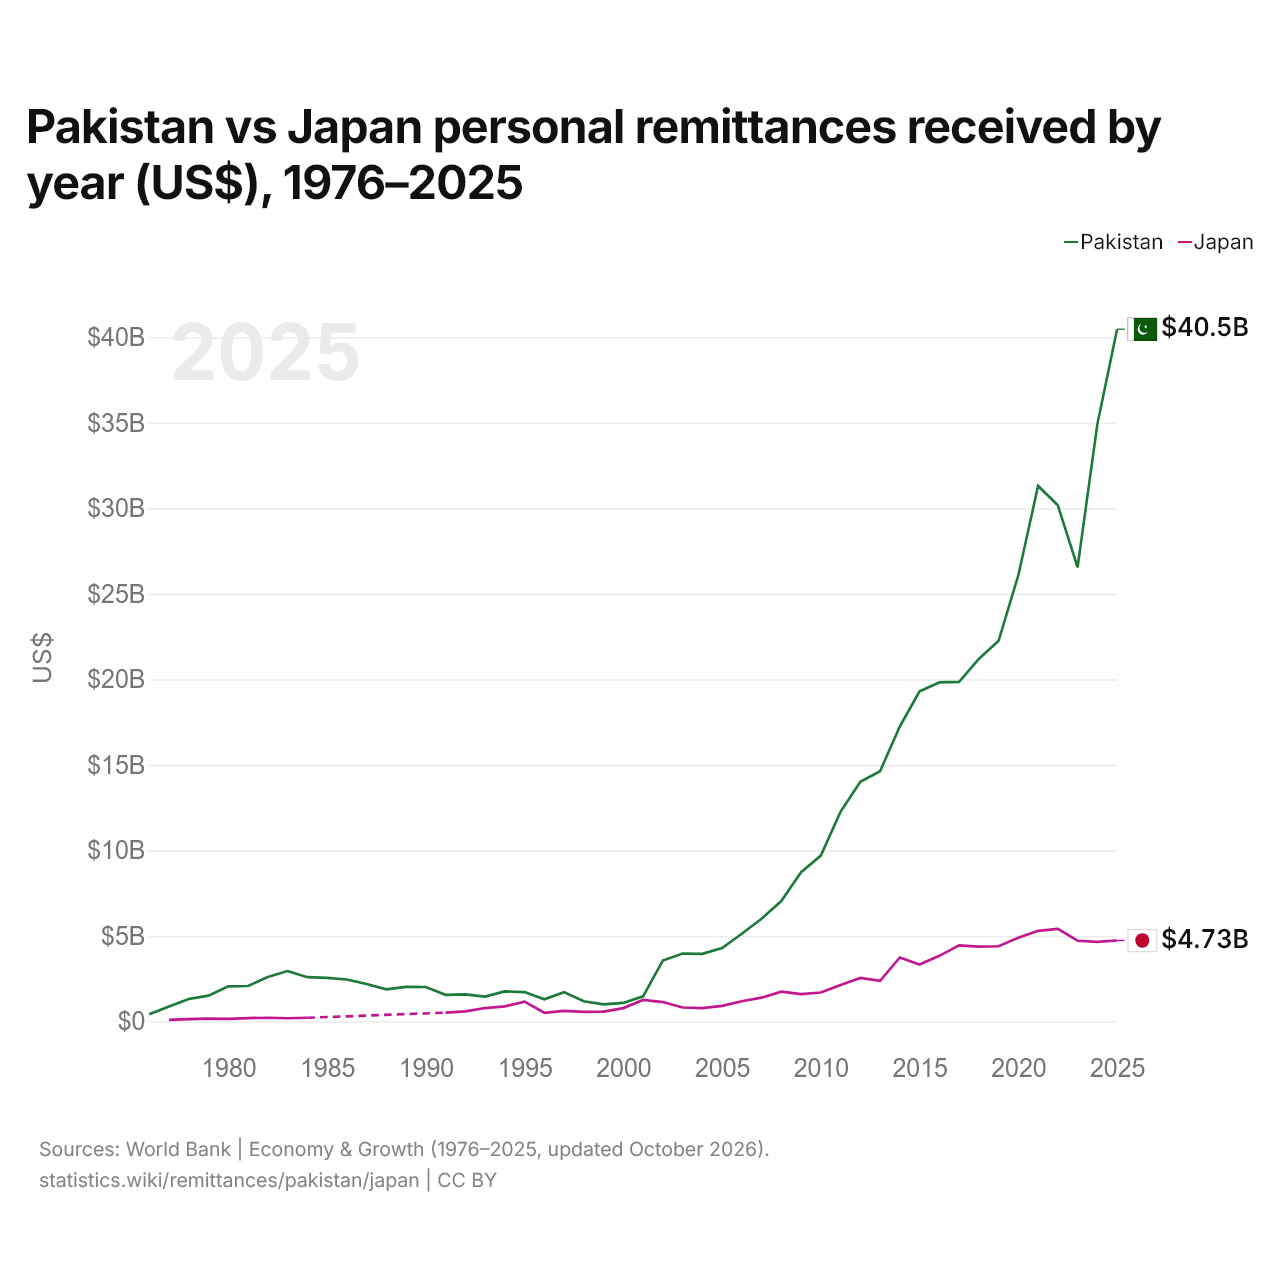
Pakistan vs Japon : envois de fonds personnels reçus par année ($ US), 1976–2025
| Année | $ US | |
|---|---|---|
 Pakistan |
 Japon |
|
| 2025 | 40 478 000 000 $ US | 4 726 839 295 $ US |
| 2024 | 34 914 000 000 $ US | 4 645 434 226 $ US |
| 2023 | 26 558 000 000 $ US | 4 712 286 544 $ US |
| 2022 | 30 176 000 000 $ US | 5 407 997 507 $ US |
| 2021 | 31 312 000 000 $ US | 5 293 894 065 $ US |
| 2020 | 26 089 000 000 $ US | 4 887 784 631 $ US |
| 2019 | 22 252 000 000 $ US | 4 388 723 266 $ US |
| 2018 | 21 193 000 000 $ US | 4 369 453 719 $ US |
| 2017 | 19 856 000 000 $ US | 4 443 028 775 $ US |
| 2016 | 19 819 000 000 $ US | 3 830 448 522 $ US |
| 2015 | 19 306 000 000 $ US | 3 325 097 903 $ US |
| 2014 | 17 244 000 000 $ US | 3 733 912 542 $ US |
| 2013 | 14 629 000 000 $ US | 2 363 853 398 $ US |
| 2012 | 14 007 000 000 $ US | 2 539 577 665 $ US |
| 2011 | 12 263 000 000 $ US | 2 131 729 225 $ US |
| 2010 | 9 690 000 000 $ US | 1 684 468 955 $ US |
| 2009 | 8 717 000 000 $ US | 1 594 532 178 $ US |
| 2008 | 7 039 000 000 $ US | 1 732 378 923 $ US |
| 2007 | 5 998 000 000 $ US | 1 383 930 644 $ US |
| 2006 | 5 121 000 000 $ US | 1 176 988 480 $ US |
| 2005 | 4 280 000 000 $ US | 904 981 241 $ US |
| 2004 | 3 945 000 000 $ US | 773 574 711 $ US |
| 2003 | 3 964 000 000 $ US | 811 141 121 $ US |
| 2002 | 3 554 000 000 $ US | 1 126 867 033 $ US |
| 2001 | 1 461 000 000 $ US | 1 249 546 432 $ US |
| 2000 | 1 075 000 000 $ US | 773 406 710 $ US |
| 1999 | 996 000 000 $ US | 566 473 895 $ US |
| 1998 | 1 172 000 000 $ US | 553 758 615 $ US |
| 1997 | 1 707 282 925 $ US | 614 882 056 $ US |
| 1996 | 1 284 050 241 $ US | 500 165 527 $ US |
| 1995 | 1 712 219 436 $ US | 1 150 964 233 $ US |
| 1994 | 1 749 277 100 $ US | 874 147 339 $ US |
| 1993 | 1 446 277 100 $ US | 776 544 983 $ US |
| 1992 | 1 573 619 019 $ US | 581 996 643 $ US |
| 1991 | 1 548 698 364 $ US | 508 114 349 $ US |
| 1990 | 2 006 266 968 $ US | - |
| 1989 | 2 017 306 152 $ US | - |
| 1988 | 1 871 958 252 $ US | - |
| 1987 | 2 180 528 076 $ US | - |
| 1986 | 2 446 387 207 $ US | - |
| 1985 | 2 537 092 529 $ US | - |
| 1984 | 2 580 805 664 $ US | 210 000 000 $ US |
| 1983 | 2 940 239 990 $ US | 180 000 000 $ US |
| 1982 | 2 588 121 582 $ US | 210 000 000 $ US |
| 1981 | 2 067 108 154 $ US | 190 000 000 $ US |
| 1980 | 2 047 622 437 $ US | 140 000 000 $ US |
| 1979 | 1 501 616 821 $ US | 160 000 000 $ US |
| 1978 | 1 309 296 997 $ US | 130 000 000 $ US |
| 1977 | 872 086 609 $ US | 90 000 000 $ US |
| 1976 | 411 736 939 $ US | - |
En 2025, les envois de fonds personnels reçus s'élevaient à 40,5 milliards de dollars au Pakistan et à 4,73 milliards de dollars au Japon : 8,6 fois plus au Pakistan. En 1977, les envois de fonds reçus étaient 9,7 fois plus élevés au Pakistan : 872 millions de dollars au Pakistan et 90 millions de dollars au Japon.
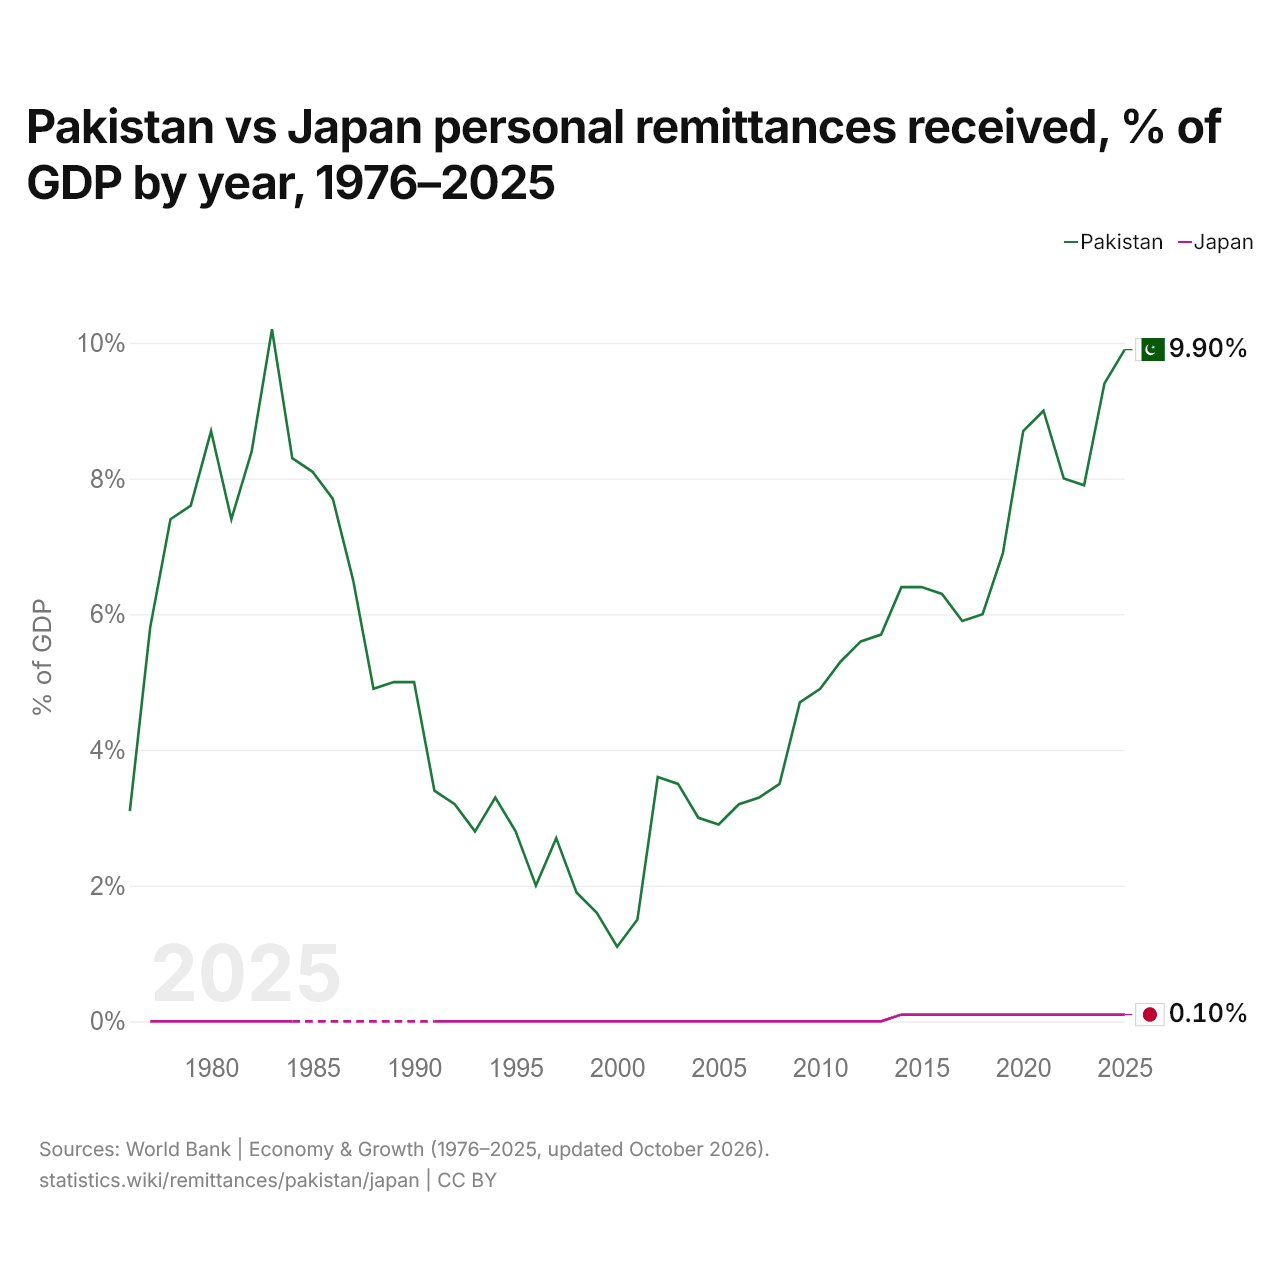
Pakistan vs Japon : envois de fonds personnels reçus, % du PIB par année, 1976–2025
| Année | % du PIB | |
|---|---|---|
|
Pakistan
|
Japon
|
|
| 2025 | 9,9 % | 0,1 % |
| 2024 | 9,4 % | 0,1 % |
| 2023 | 7,9 % | 0,1 % |
| 2022 | 8 % | 0,1 % |
| 2021 | 9 % | 0,1 % |
| 2020 | 8,7 % | 0,1 % |
| 2019 | 6,9 % | 0,1 % |
| 2018 | 6 % | 0,1 % |
| 2017 | 5,9 % | 0,1 % |
| 2016 | 6,3 % | 0,1 % |
| 2015 | 6,4 % | 0,1 % |
| 2014 | 6,4 % | 0,1 % |
| 2013 | 5,7 % | 0 % |
| 2012 | 5,6 % | 0 % |
| 2011 | 5,3 % | 0 % |
| 2010 | 4,9 % | 0 % |
| 2009 | 4,7 % | 0 % |
| 2008 | 3,5 % | 0 % |
| 2007 | 3,3 % | 0 % |
| 2006 | 3,2 % | 0 % |
| 2005 | 2,9 % | 0 % |
| 2004 | 3 % | 0 % |
| 2003 | 3,5 % | 0 % |
| 2002 | 3,6 % | 0 % |
| 2001 | 1,5 % | 0 % |
| 2000 | 1,1 % | 0 % |
| 1999 | 1,6 % | 0 % |
| 1998 | 1,9 % | 0 % |
| 1997 | 2,7 % | 0 % |
| 1996 | 2 % | 0 % |
| 1995 | 2,8 % | 0 % |
| 1994 | 3,3 % | 0 % |
| 1993 | 2,8 % | 0 % |
| 1992 | 3,2 % | 0 % |
| 1991 | 3,4 % | 0 % |
| 1990 | 5 % | - |
| 1989 | 5 % | - |
| 1988 | 4,9 % | - |
| 1987 | 6,5 % | - |
| 1986 | 7,7 % | - |
| 1985 | 8,1 % | - |
| 1984 | 8,3 % | 0 % |
| 1983 | 10,2 % | 0 % |
| 1982 | 8,4 % | 0 % |
| 1981 | 7,4 % | 0 % |
| 1980 | 8,7 % | 0 % |
| 1979 | 7,6 % | 0 % |
| 1978 | 7,4 % | 0 % |
| 1977 | 5,8 % | 0 % |
| 1976 | 3,1 % | - |
En 2025, les envois de fonds reçus équivalaient à 9,9 % du PIB au Pakistan et à 0,1 % au Japon : 9,8 points de pourcentage de plus au Pakistan. En 2015, les parts étaient de 6,4 % au Pakistan et de 0,1 % au Japon, soit 6,3 points de pourcentage de plus au Pakistan.
Pakistan vs Japon : derniers envois de fonds en $ US et % du PIB
|
Pakistan
|
Japon
|
|
|---|---|---|
| Envois de fonds reçus | 40,5 Md $US | 4,73 Md $US |
| % du PIB | 9,9 % | 0,1 % |
| Rang mondial | 6/181 | 47/181 |
Comparer les envois de fonds reçus par 2 pays au choix
Sources :
- Banque mondiale | Économie et croissance (1976–2025, mis à jour en octobre 2026)
Creative Commons Attribution (CC BY) : vous pouvez copier, partager, adapter et réutiliser ce contenu, y compris à des fins commerciales, à condition de citer statistics.wiki et d’indiquer les modifications apportées. Les sources citées ci-dessus peuvent avoir leurs propres conditions de licence.