
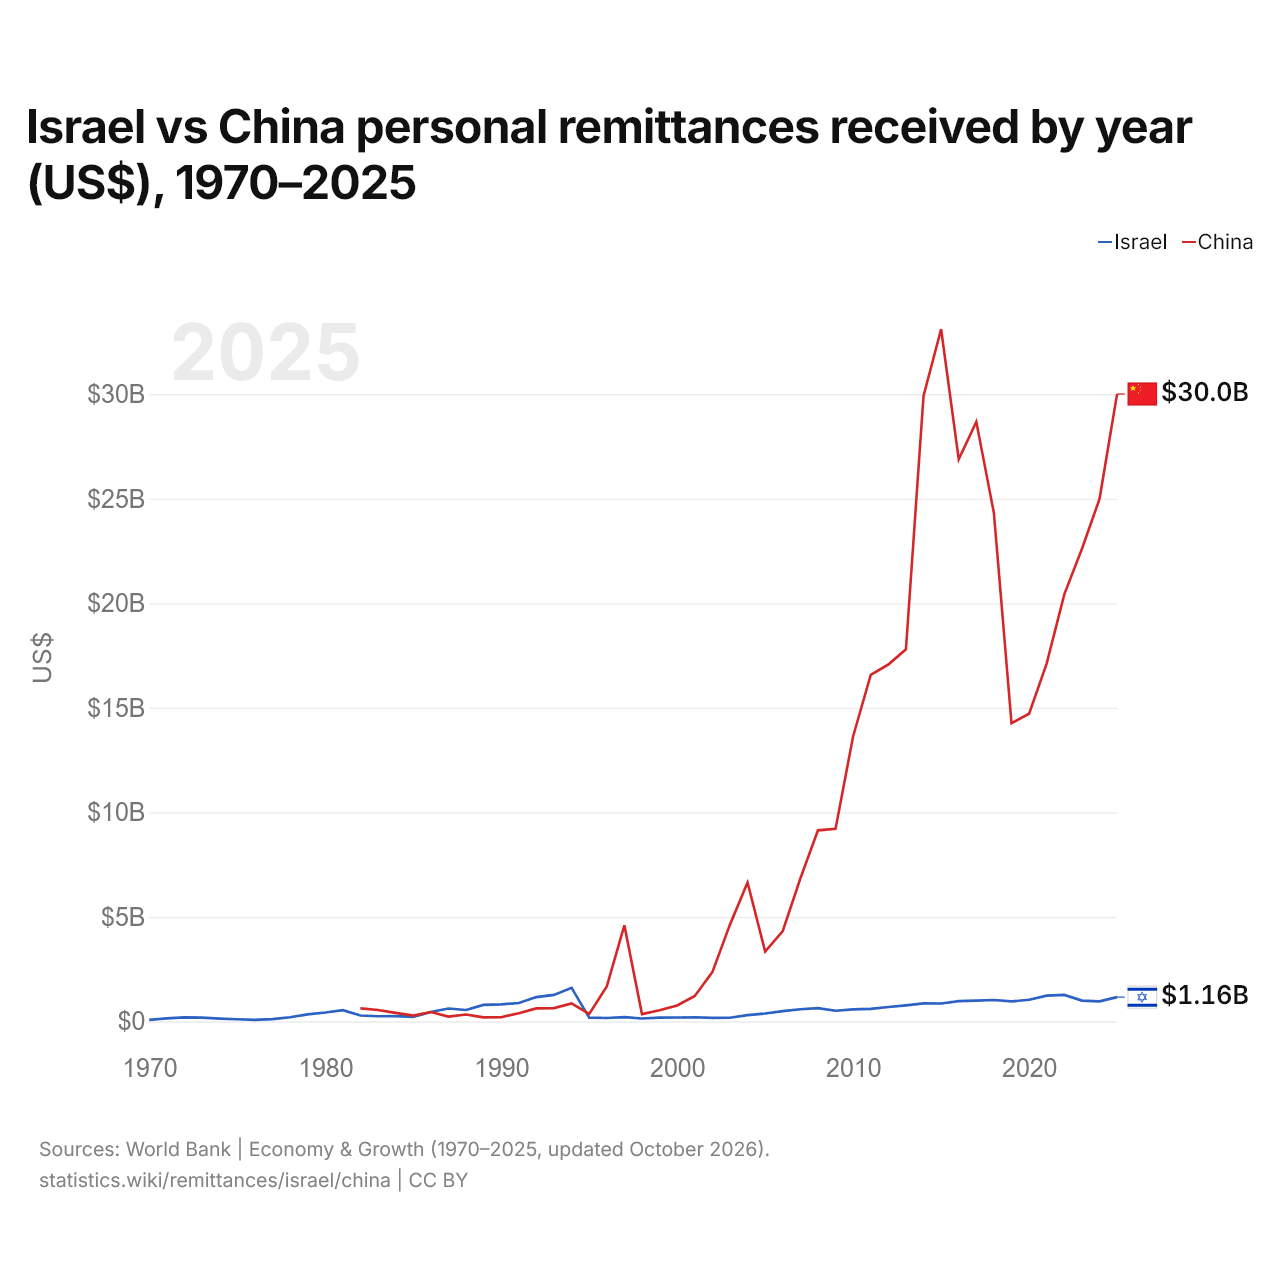
Israël vs Chine : envois de fonds personnels reçus par année ($ US), 1970–2025
| Année | $ US | |
|---|---|---|
 Israël |
 Chine |
|
| 2025 | 1 156 800 000 $ US | 30 002 559 371 $ US |
| 2024 | 952 300 000 $ US | 24 980 610 480 $ US |
| 2023 | 990 100 000 $ US | 22 592 912 425 $ US |
| 2022 | 1 265 200 000 $ US | 20 424 526 330 $ US |
| 2021 | 1 230 100 000 $ US | 17 118 443 357 $ US |
| 2020 | 1 032 700 000 $ US | 14 714 298 894 $ US |
| 2019 | 953 400 000 $ US | 14 257 782 655 $ US |
| 2018 | 1 021 600 000 $ US | 24 305 605 211 $ US |
| 2017 | 991 200 000 $ US | 28 675 983 092 $ US |
| 2016 | 963 400 000 $ US | 26 883 278 894 $ US |
| 2015 | 853 100 000 $ US | 33 104 675 862 $ US |
| 2014 | 859 000 000 $ US | 29 910 500 593 $ US |
| 2013 | 764 800 000 $ US | 17 790 105 219 $ US |
| 2012 | 684 900 000 $ US | 17 065 623 287 $ US |
| 2011 | 594 600 000 $ US | 16 568 371 453 $ US |
| 2010 | 571 500 000 $ US | 13 636 040 942 $ US |
| 2009 | 507 000 000 $ US | 9 209 489 821 $ US |
| 2008 | 628 400 000 $ US | 9 136 546 900 $ US |
| 2007 | 579 700 000 $ US | 6 833 129 702 $ US |
| 2006 | 488 800 000 $ US | 4 319 492 609 $ US |
| 2005 | 376 900 000 $ US | 3 337 061 829 $ US |
| 2004 | 297 700 000 $ US | 6 641 220 179 $ US |
| 2003 | 171 200 000 $ US | 4 625 331 810 $ US |
| 2002 | 166 600 000 $ US | 2 353 070 422 $ US |
| 2001 | 195 600 000 $ US | 1 209 000 000 $ US |
| 2000 | 182 400 000 $ US | 758 082 000 $ US |
| 1999 | 174 200 000 $ US | 530 000 000 $ US |
| 1998 | 134 500 000 $ US | 344 000 000 $ US |
| 1997 | 200 200 000 $ US | 4 589 000 000 $ US |
| 1996 | 157 600 000 $ US | 1 672 000 000 $ US |
| 1995 | 177 900 000 $ US | 350 000 000 $ US |
| 1994 | 1 602 300 049 $ US | 857 000 000 $ US |
| 1993 | 1 263 300 049 $ US | 631 380 000 $ US |
| 1992 | 1 160 199 951 $ US | 619 380 000 $ US |
| 1991 | 876 799 988 $ US | 389 820 000 $ US |
| 1990 | 811 900 024 $ US | 195 940 000 $ US |
| 1989 | 783 700 012 $ US | 188 860 000 $ US |
| 1988 | 542 000 000 $ US | 326 340 000 $ US |
| 1987 | 613 599 976 $ US | 228 040 000 $ US |
| 1986 | 448 700 012 $ US | 445 280 000 $ US |
| 1985 | 209 399 994 $ US | 271 000 000 $ US |
| 1984 | 253 000 000 $ US | 403 000 000 $ US |
| 1983 | 242 600 006 $ US | 542 000 000 $ US |
| 1982 | 280 299 988 $ US | 617 320 000 $ US |
| 1981 | 531 799 988 $ US | - |
| 1980 | 421 000 000 $ US | - |
| 1979 | 335 000 000 $ US | - |
| 1978 | 194 000 000 $ US | - |
| 1977 | 106 000 000 $ US | - |
| 1976 | 72 000 000 $ US | - |
| 1975 | 101 000 000 $ US | - |
| 1974 | 130 000 000 $ US | - |
| 1973 | 178 000 000 $ US | - |
| 1972 | 190 000 000 $ US | - |
| 1971 | 140 000 000 $ US | - |
| 1970 | 72 000 000 $ US | - |
En 2025, les envois de fonds personnels reçus s'élevaient à 1,16 milliard de dollars en Israël et à 30 milliards de dollars en Chine : 26 fois plus en Chine. En 1982, les envois de fonds reçus étaient 2,2 fois plus élevés en Chine : 280 millions de dollars en Israël et 617 millions de dollars en Chine.
Les envois de fonds personnels reçus en Chine sont supérieurs à ceux reçus en Israël chaque année depuis 1995.
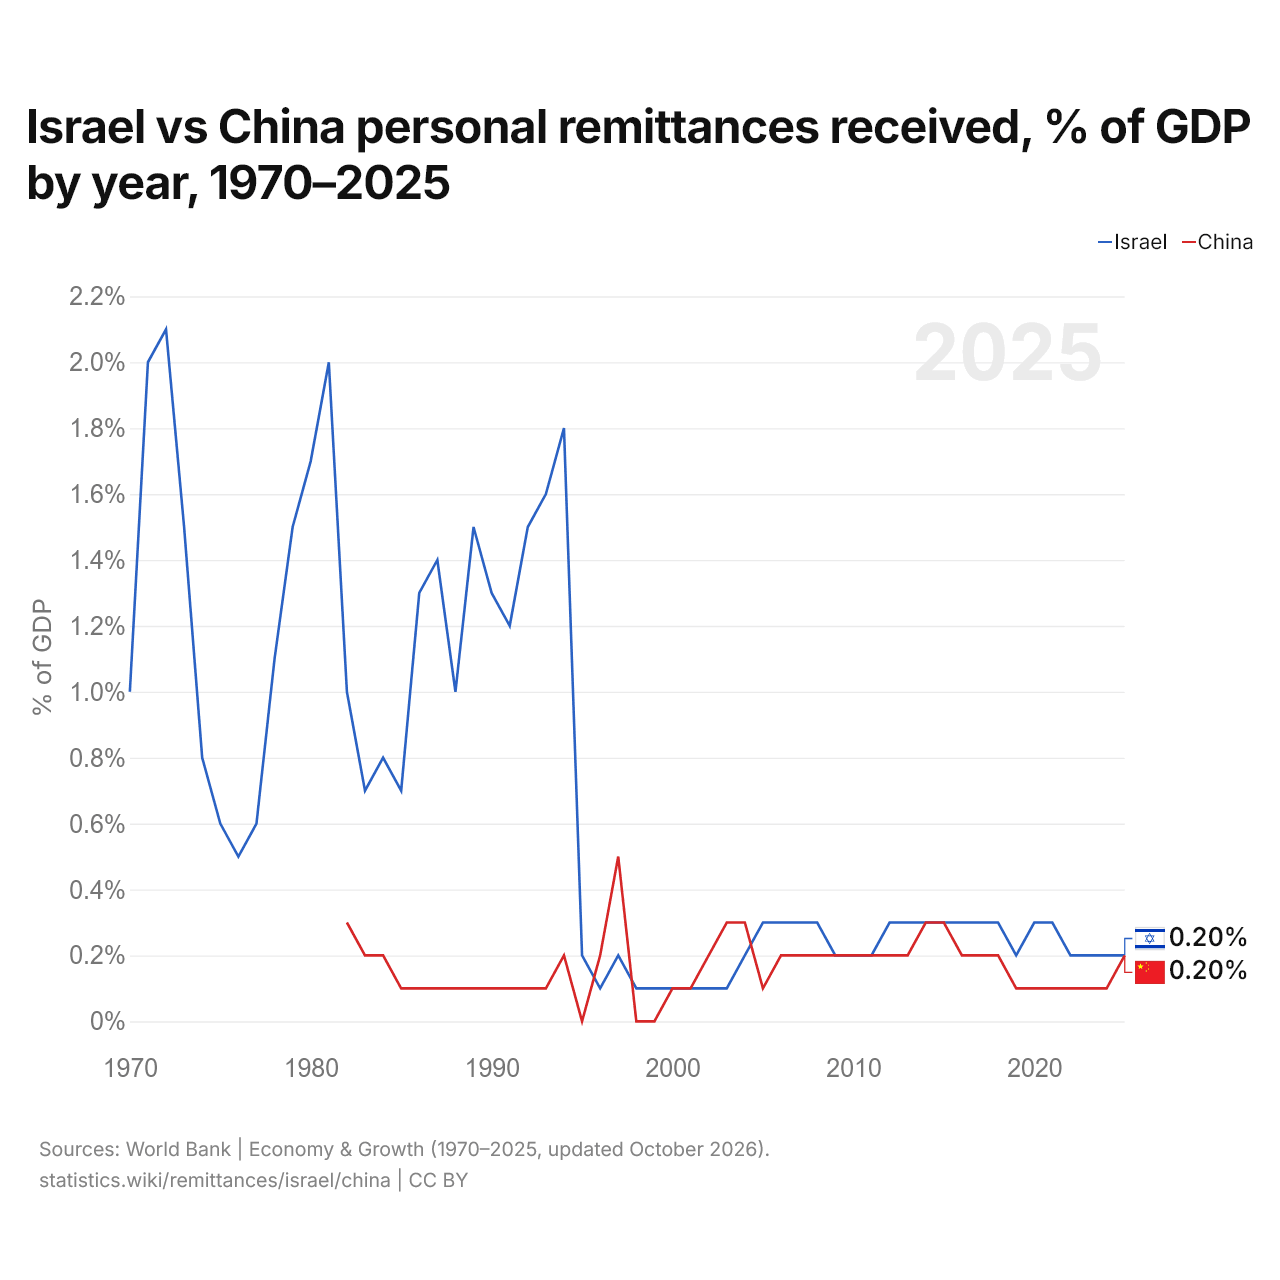
Israël vs Chine : envois de fonds personnels reçus, % du PIB par année, 1970–2025
| Année | % du PIB | |
|---|---|---|
|
Israël
|
Chine
|
|
| 2025 | 0,2 % | 0,2 % |
| 2024 | 0,2 % | 0,1 % |
| 2023 | 0,2 % | 0,1 % |
| 2022 | 0,2 % | 0,1 % |
| 2021 | 0,3 % | 0,1 % |
| 2020 | 0,3 % | 0,1 % |
| 2019 | 0,2 % | 0,1 % |
| 2018 | 0,3 % | 0,2 % |
| 2017 | 0,3 % | 0,2 % |
| 2016 | 0,3 % | 0,2 % |
| 2015 | 0,3 % | 0,3 % |
| 2014 | 0,3 % | 0,3 % |
| 2013 | 0,3 % | 0,2 % |
| 2012 | 0,3 % | 0,2 % |
| 2011 | 0,2 % | 0,2 % |
| 2010 | 0,2 % | 0,2 % |
| 2009 | 0,2 % | 0,2 % |
| 2008 | 0,3 % | 0,2 % |
| 2007 | 0,3 % | 0,2 % |
| 2006 | 0,3 % | 0,2 % |
| 2005 | 0,3 % | 0,1 % |
| 2004 | 0,2 % | 0,3 % |
| 2003 | 0,1 % | 0,3 % |
| 2002 | 0,1 % | 0,2 % |
| 2001 | 0,1 % | 0,1 % |
| 2000 | 0,1 % | 0,1 % |
| 1999 | 0,1 % | 0 % |
| 1998 | 0,1 % | 0 % |
| 1997 | 0,2 % | 0,5 % |
| 1996 | 0,1 % | 0,2 % |
| 1995 | 0,2 % | 0 % |
| 1994 | 1,8 % | 0,2 % |
| 1993 | 1,6 % | 0,1 % |
| 1992 | 1,5 % | 0,1 % |
| 1991 | 1,2 % | 0,1 % |
| 1990 | 1,3 % | 0,1 % |
| 1989 | 1,5 % | 0,1 % |
| 1988 | 1 % | 0,1 % |
| 1987 | 1,4 % | 0,1 % |
| 1986 | 1,3 % | 0,1 % |
| 1985 | 0,7 % | 0,1 % |
| 1984 | 0,8 % | 0,2 % |
| 1983 | 0,7 % | 0,2 % |
| 1982 | 1 % | 0,3 % |
| 1981 | 2 % | - |
| 1980 | 1,7 % | - |
| 1979 | 1,5 % | - |
| 1978 | 1,1 % | - |
| 1977 | 0,6 % | - |
| 1976 | 0,5 % | - |
| 1975 | 0,6 % | - |
| 1974 | 0,8 % | - |
| 1973 | 1,5 % | - |
| 1972 | 2,1 % | - |
| 1971 | 2 % | - |
| 1970 | 1 % | - |
En 2025, les envois de fonds reçus équivalaient à 0,2 % du PIB en Israël et à 0,2 % en Chine. En 2015, les parts étaient de 0,3 % en Israël et de 0,3 % en Chine.
Israël vs Chine : derniers envois de fonds en $ US et % du PIB
|
Israël
|
Chine
|
|
|---|---|---|
| Envois de fonds reçus | 1,16 Md $US | 30,0 Md $US |
| % du PIB | 0,2 % | 0,2 % |
| Rang mondial | 86/181 | 8/181 |
Comparer les envois de fonds reçus par 2 pays au choix
Sources :
- Banque mondiale | Économie et croissance (1970–2025, mis à jour en octobre 2026)
Creative Commons Attribution (CC BY) : vous pouvez copier, partager, adapter et réutiliser ce contenu, y compris à des fins commerciales, à condition de citer statistics.wiki et d’indiquer les modifications apportées. Les sources citées ci-dessus peuvent avoir leurs propres conditions de licence.