
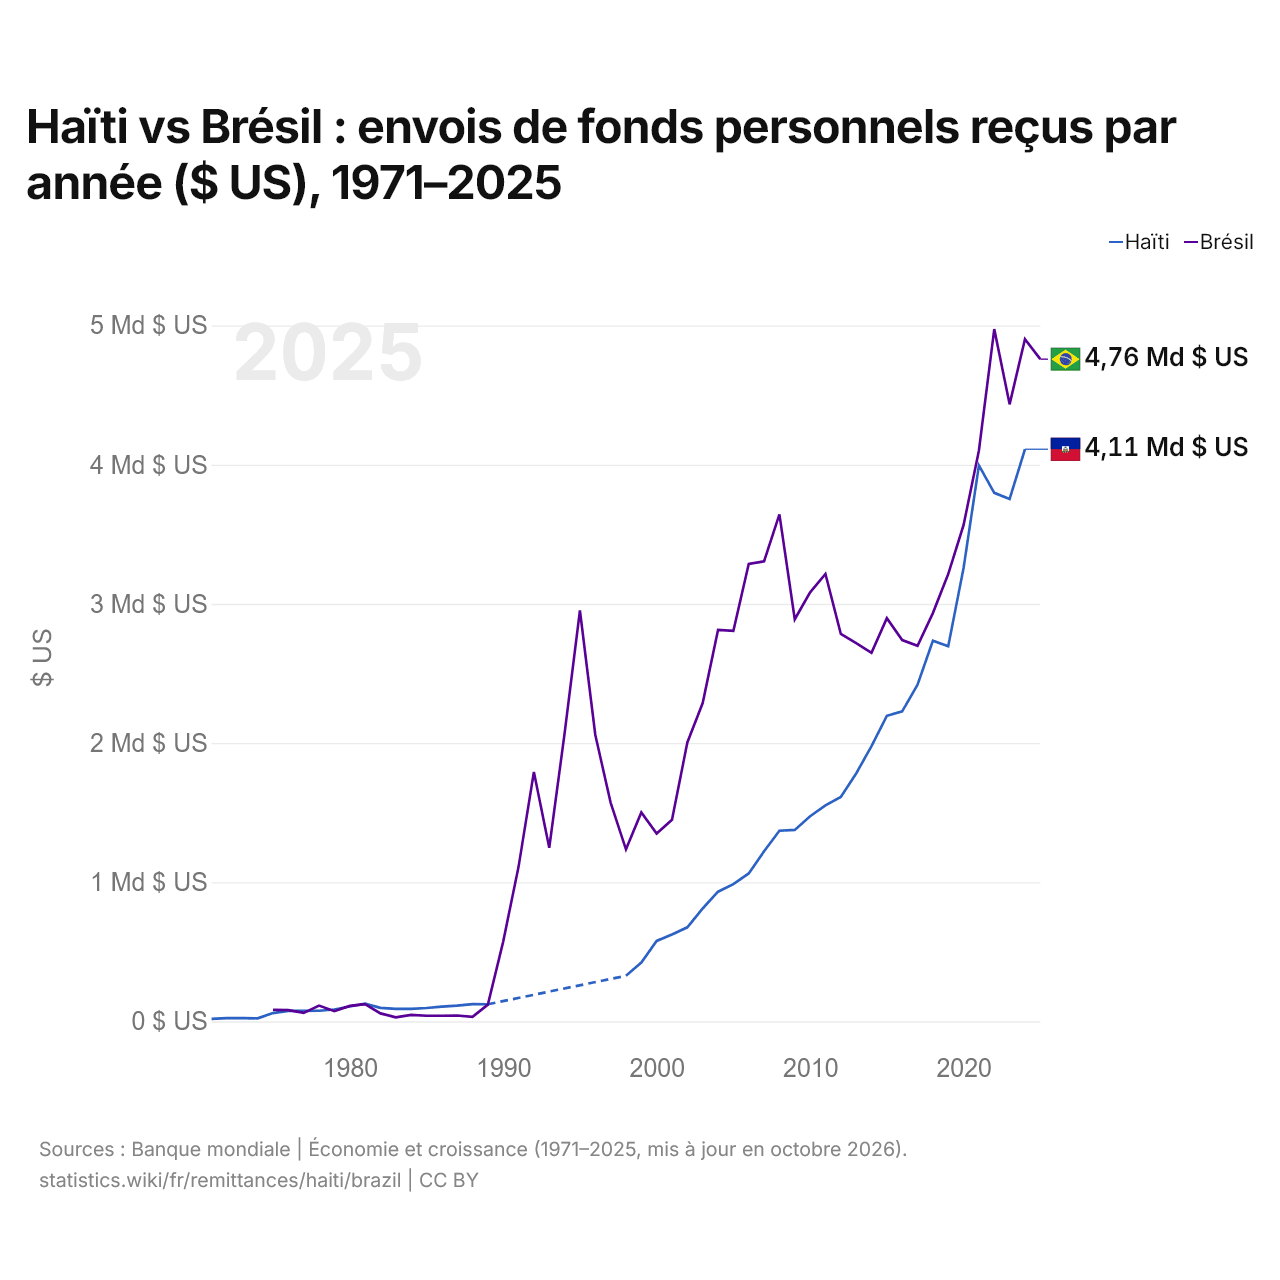
Haïti vs Brésil : envois de fonds personnels reçus par année ($ US), 1971–2025
| Année | $ US | |
|---|---|---|
 Haïti |
 Brésil |
|
| 2025 | - | 4 758 109 117 $ US |
| 2024 | 4 111 002 566 $ US | 4 902 400 448 $ US |
| 2023 | 3 753 251 985 $ US | 4 433 700 953 $ US |
| 2022 | 3 797 752 749 $ US | 4 973 758 735 $ US |
| 2021 | 3 994 393 883 $ US | 4 102 018 148 $ US |
| 2020 | 3 257 277 840 $ US | 3 566 219 438 $ US |
| 2019 | 2 695 149 514 $ US | 3 213 621 677 $ US |
| 2018 | 2 735 177 967 $ US | 2 933 489 276 $ US |
| 2017 | 2 419 165 424 $ US | 2 698 770 651 $ US |
| 2016 | 2 227 109 372 $ US | 2 739 786 527 $ US |
| 2015 | 2 195 560 227 $ US | 2 896 909 952 $ US |
| 2014 | 1 977 033 926 $ US | 2 647 908 513 $ US |
| 2013 | 1 780 995 274 $ US | 2 717 675 069 $ US |
| 2012 | 1 612 326 050 $ US | 2 784 072 055 $ US |
| 2011 | 1 551 366 394 $ US | 3 214 602 243 $ US |
| 2010 | 1 473 804 721 $ US | 3 082 801 866 $ US |
| 2009 | 1 375 546 872 $ US | 2 889 159 500 $ US |
| 2008 | 1 369 753 973 $ US | 3 642 585 000 $ US |
| 2007 | 1 222 089 000 $ US | 3 305 694 000 $ US |
| 2006 | 1 062 869 000 $ US | 3 287 162 000 $ US |
| 2005 | 986 154 000 $ US | 2 805 358 000 $ US |
| 2004 | 931 540 000 $ US | 2 812 514 000 $ US |
| 2003 | 811 000 000 $ US | 2 286 680 000 $ US |
| 2002 | 675 660 000 $ US | 2 003 791 000 $ US |
| 2001 | 623 580 000 $ US | 1 448 914 000 $ US |
| 2000 | 578 000 000 $ US | 1 349 591 000 $ US |
| 1999 | 422 050 000 $ US | 1 501 000 000 $ US |
| 1998 | 327 300 000 $ US | 1 236 000 000 $ US |
| 1997 | - | 1 572 000 000 $ US |
| 1996 | - | 2 059 000 000 $ US |
| 1995 | - | 2 952 000 000 $ US |
| 1994 | - | 2 068 000 000 $ US |
| 1993 | - | 1 247 000 000 $ US |
| 1992 | - | 1 791 000 000 $ US |
| 1991 | - | 1 110 000 000 $ US |
| 1990 | - | 573 000 000 $ US |
| 1989 | 122 800 003 $ US | 120 000 000 $ US |
| 1988 | 124 099 999 $ US | 32 000 000 $ US |
| 1987 | 113 160 004 $ US | 42 000 000 $ US |
| 1986 | 105 419 998 $ US | 40 000 000 $ US |
| 1985 | 95 779 999 $ US | 40 000 000 $ US |
| 1984 | 90 000 000 $ US | 46 000 000 $ US |
| 1983 | 89 879 997 $ US | 29 000 000 $ US |
| 1982 | 97 040 001 $ US | 57 000 000 $ US |
| 1981 | 126 620 003 $ US | 124 000 000 $ US |
| 1980 | 106 440 002 $ US | 111 000 000 $ US |
| 1979 | 84 779 999 $ US | 73 000 000 $ US |
| 1978 | 76 000 000 $ US | 113 000 000 $ US |
| 1977 | 75 019 997 $ US | 61 000 000 $ US |
| 1976 | 74 699 997 $ US | 81 000 000 $ US |
| 1975 | 59 220 001 $ US | 82 000 000 $ US |
| 1974 | 21 659 983 $ US | - |
| 1973 | 22 540 001 $ US | - |
| 1972 | 22 579 916 $ US | - |
| 1971 | 17 900 000 $ US | - |
Les envois de fonds personnels reçus s'élevaient à 4,11 milliards de dollars en Haïti (2024) et à 4,9 milliards de dollars au Brésil (2024) : 19 % de plus au Brésil. En 1975, les envois de fonds reçus étaient supérieurs de 38 % au Brésil : 59,2 millions de dollars en Haïti et 82 millions de dollars au Brésil.
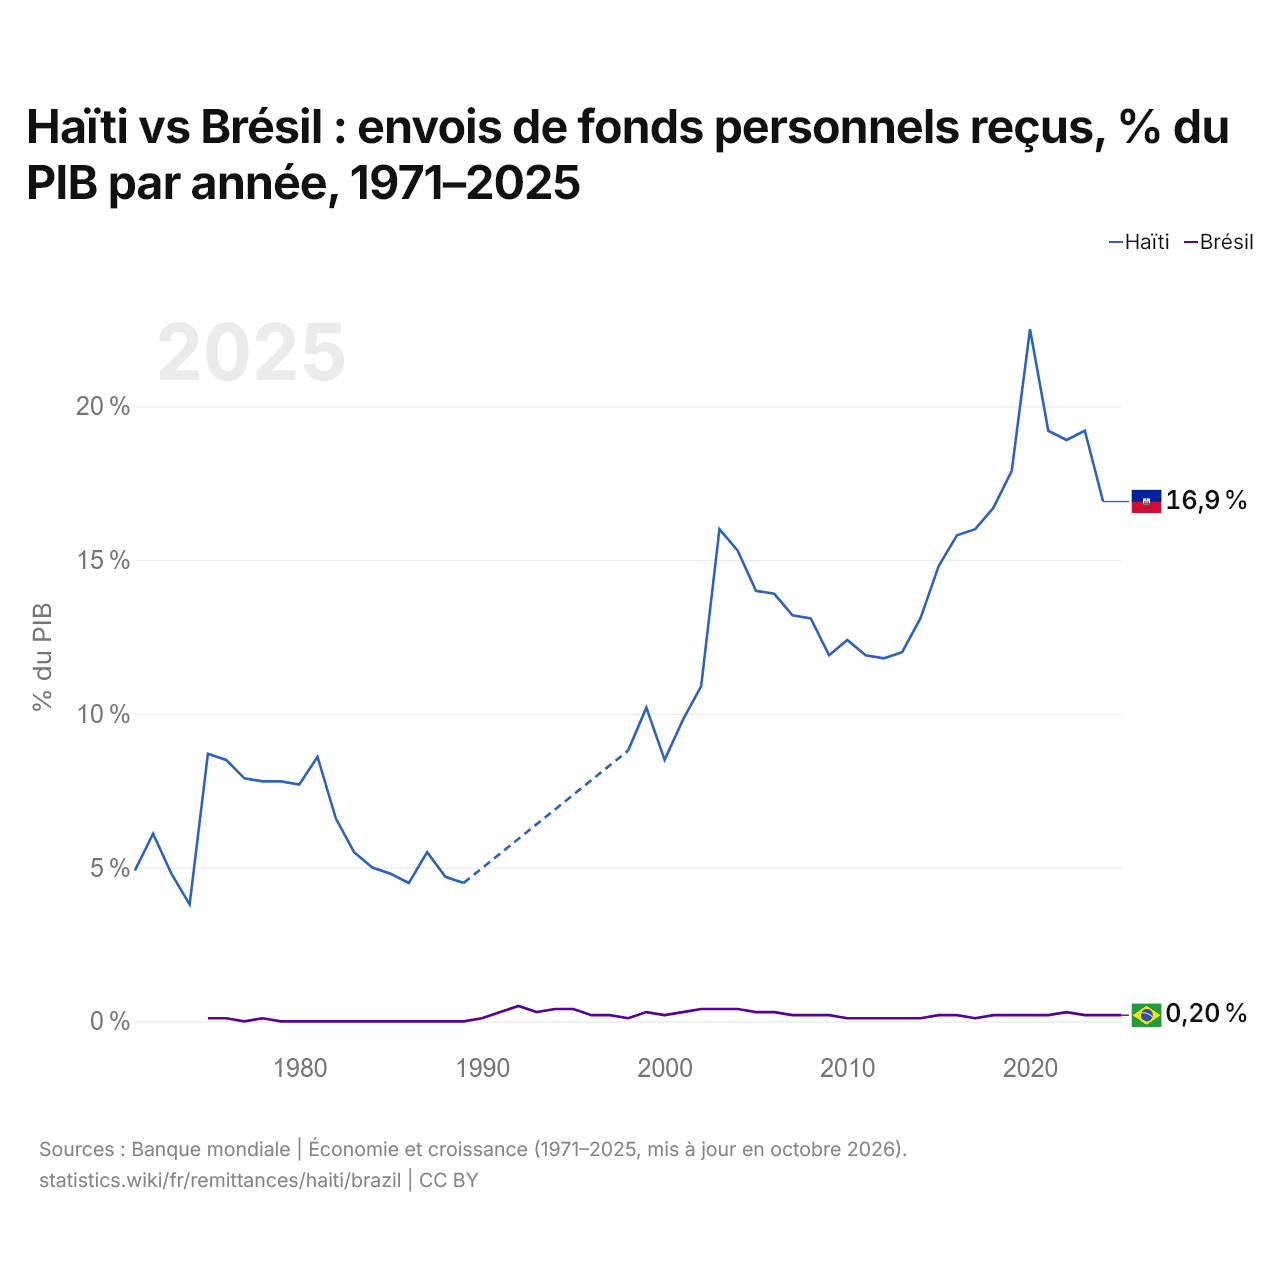
Haïti vs Brésil : envois de fonds personnels reçus, % du PIB par année, 1971–2025
| Année | % du PIB | |
|---|---|---|
|
Haïti
|
Brésil
|
|
| 2025 | - | 0,2 % |
| 2024 | 16,9 % | 0,2 % |
| 2023 | 19,2 % | 0,2 % |
| 2022 | 18,9 % | 0,3 % |
| 2021 | 19,2 % | 0,2 % |
| 2020 | 22,5 % | 0,2 % |
| 2019 | 17,9 % | 0,2 % |
| 2018 | 16,7 % | 0,2 % |
| 2017 | 16 % | 0,1 % |
| 2016 | 15,8 % | 0,2 % |
| 2015 | 14,8 % | 0,2 % |
| 2014 | 13,1 % | 0,1 % |
| 2013 | 12 % | 0,1 % |
| 2012 | 11,8 % | 0,1 % |
| 2011 | 11,9 % | 0,1 % |
| 2010 | 12,4 % | 0,1 % |
| 2009 | 11,9 % | 0,2 % |
| 2008 | 13,1 % | 0,2 % |
| 2007 | 13,2 % | 0,2 % |
| 2006 | 13,9 % | 0,3 % |
| 2005 | 14 % | 0,3 % |
| 2004 | 15,3 % | 0,4 % |
| 2003 | 16 % | 0,4 % |
| 2002 | 10,9 % | 0,4 % |
| 2001 | 9,8 % | 0,3 % |
| 2000 | 8,5 % | 0,2 % |
| 1999 | 10,2 % | 0,3 % |
| 1998 | 8,8 % | 0,1 % |
| 1997 | - | 0,2 % |
| 1996 | - | 0,2 % |
| 1995 | - | 0,4 % |
| 1994 | - | 0,4 % |
| 1993 | - | 0,3 % |
| 1992 | - | 0,5 % |
| 1991 | - | 0,3 % |
| 1990 | - | 0,1 % |
| 1989 | 4,5 % | 0 % |
| 1988 | 4,7 % | 0 % |
| 1987 | 5,5 % | 0 % |
| 1986 | 4,5 % | 0 % |
| 1985 | 4,8 % | 0 % |
| 1984 | 5 % | 0 % |
| 1983 | 5,5 % | 0 % |
| 1982 | 6,6 % | 0 % |
| 1981 | 8,6 % | 0 % |
| 1980 | 7,7 % | 0 % |
| 1979 | 7,8 % | 0 % |
| 1978 | 7,8 % | 0,1 % |
| 1977 | 7,9 % | 0 % |
| 1976 | 8,5 % | 0,1 % |
| 1975 | 8,7 % | 0,1 % |
| 1974 | 3,8 % | - |
| 1973 | 4,8 % | - |
| 1972 | 6,1 % | - |
| 1971 | 4,9 % | - |
Les envois de fonds reçus équivalaient à 16,9 % du PIB en Haïti (2024) et à 0,2 % au Brésil (2024) : 16,7 points de pourcentage de plus en Haïti. En 2014, les parts étaient de 13,1 % en Haïti et de 0,1 % au Brésil, soit 13,0 points de pourcentage de plus en Haïti.
Haïti vs Brésil : derniers envois de fonds en $ US et % du PIB
|
Haïti
|
Brésil
|
|
|---|---|---|
| Envois de fonds reçus | 4,11 Md $US (2024) | 4,76 Md $US (2025) |
| % du PIB | 16,9 % (2024) | 0,2 % (2025) |
| Rang mondial | 51/181 | 46/181 |
Comparer les envois de fonds reçus par 2 pays au choix
Sources :
- Banque mondiale | Économie et croissance (1971–2025, mis à jour en octobre 2026)
Creative Commons Attribution (CC BY) : vous pouvez copier, partager, adapter et réutiliser ce contenu, y compris à des fins commerciales, à condition de citer statistics.wiki et d’indiquer les modifications apportées. Les sources citées ci-dessus peuvent avoir leurs propres conditions de licence.