
Arabie saoudite vs Israël : exportations de métaux précieux et bijoux, 2001–2025 (y compris pierres précieuses, montres, instruments de musique et art)
| Année | Exportations | |
|---|---|---|
 Arabie saoudite |
 Israël |
|
| 2025 | 5 141 899 000 $ US | 5 050 574 000 $ US |
| 2024 | 2 912 185 000 $ US | 6 518 411 000 $ US |
| 2023 | 2 944 632 000 $ US | 8 144 900 000 $ US |
| 2022 | 1 815 718 000 $ US | 11 888 323 000 $ US |
| 2021 | 2 278 352 000 $ US | 9 694 312 000 $ US |
| 2020 | 2 410 904 000 $ US | 6 068 577 000 $ US |
| 2019 | 1 925 926 000 $ US | 12 078 964 000 $ US |
| 2018 | 1 155 451 000 $ US | 14 999 769 000 $ US |
| 2017 | 1 088 110 000 $ US | 15 429 881 000 $ US |
| 2016 | 1 086 785 000 $ US | 16 515 683 000 $ US |
| 2015 | 708 342 000 $ US | 18 341 961 000 $ US |
| 2014 | 846 289 000 $ US | 21 292 255 000 $ US |
| 2013 | 829 936 000 $ US | 19 656 550 000 $ US |
| 2012 | 994 629 000 $ US | 18 077 409 000 $ US |
| 2011 | 1 051 755 000 $ US | 21 318 870 000 $ US |
| 2010 | 543 758 000 $ US | 16 994 005 000 $ US |
| 2009 | 896 616 000 $ US | 12 164 885 000 $ US |
| 2008 | 829 442 000 $ US | 20 082 992 000 $ US |
| 2007 | 384 784 000 $ US | 19 172 483 000 $ US |
| 2006 | 759 222 000 $ US | 16 758 505 000 $ US |
| 2005 | 282 030 000 $ US | 16 550 989 000 $ US |
| 2004 | 523 953 000 $ US | 14 510 999 000 $ US |
| 2003 | 338 225 000 $ US | 12 054 301 000 $ US |
| 2002 | 86 620 000 $ US | 10 891 992 000 $ US |
| 2001 | 69 224 000 $ US | 9 294 990 000 $ US |
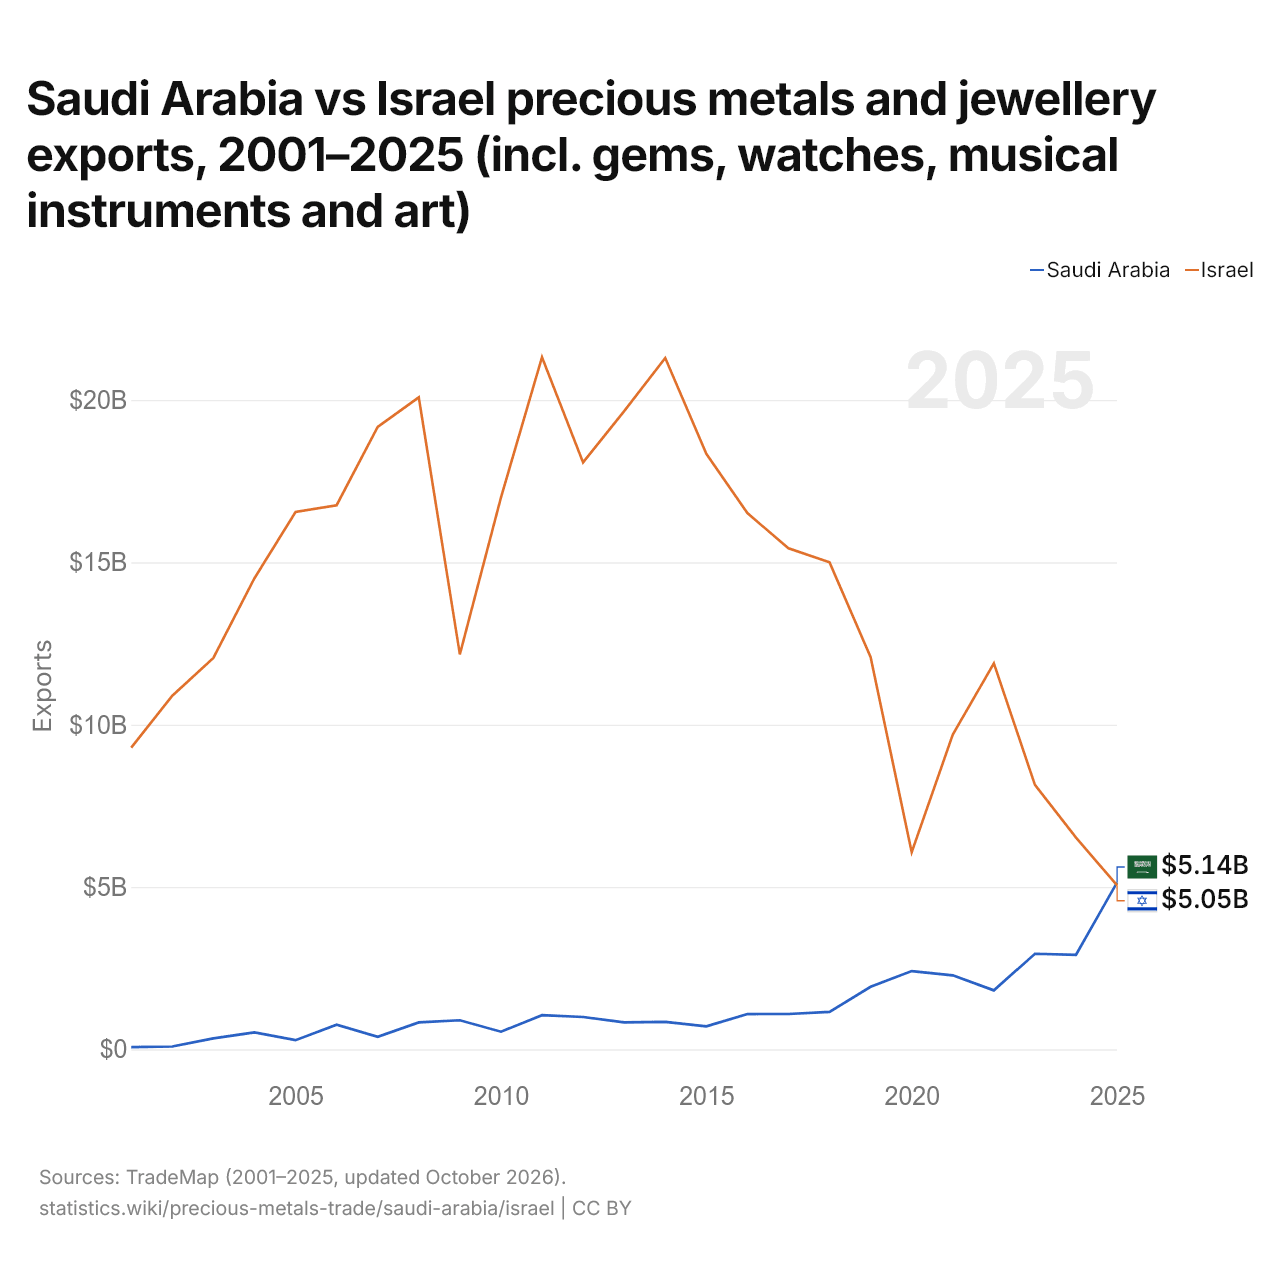
En 2025, les exportations de métaux précieux et bijoux de l'Arabie saoudite s'élevaient à 5,14 milliards de dollars et celles d'Israël à 5,05 milliards de dollars : celles de l'Arabie saoudite étaient supérieures de 1,8 %. En 2001, les exportations d'Israël étaient 130 fois plus élevées : 69,2 millions de dollars pour l'Arabie saoudite et 9,29 milliards de dollars pour Israël.
Arabie saoudite vs Israël : importations de métaux précieux et bijoux, 2001–2025
| Année | Importations | |
|---|---|---|
|
Arabie saoudite
|
Israël
|
|
| 2025 | 13 046 908 000 $ US | 3 757 441 000 $ US |
| 2024 | 11 395 494 000 $ US | 4 253 242 000 $ US |
| 2023 | 10 042 727 000 $ US | 5 313 074 000 $ US |
| 2022 | 8 038 890 000 $ US | 7 267 012 000 $ US |
| 2021 | 6 016 492 000 $ US | 7 226 195 000 $ US |
| 2020 | 2 298 116 000 $ US | 3 397 562 000 $ US |
| 2019 | 4 109 071 000 $ US | 5 313 952 000 $ US |
| 2018 | 4 772 495 000 $ US | 7 107 701 000 $ US |
| 2017 | 3 962 971 000 $ US | 7 323 567 000 $ US |
| 2016 | 3 497 363 000 $ US | 7 683 125 000 $ US |
| 2015 | 6 495 122 000 $ US | 7 421 409 000 $ US |
| 2014 | 5 811 628 000 $ US | 9 830 983 000 $ US |
| 2013 | 5 644 725 000 $ US | 9 520 526 000 $ US |
| 2012 | 3 455 449 000 $ US | 8 724 480 000 $ US |
| 2011 | 2 944 345 000 $ US | 11 315 616 000 $ US |
| 2010 | 1 640 080 000 $ US | 8 860 092 000 $ US |
| 2009 | 1 160 321 000 $ US | 5 690 619 000 $ US |
| 2008 | 1 739 720 000 $ US | 9 822 306 000 $ US |
| 2007 | 1 133 717 000 $ US | 10 540 422 000 $ US |
| 2006 | 842 898 000 $ US | 9 493 694 000 $ US |
| 2005 | 1 189 375 000 $ US | 10 104 284 000 $ US |
| 2004 | 864 913 000 $ US | 9 644 749 000 $ US |
| 2003 | 578 337 000 $ US | 8 083 961 000 $ US |
| 2002 | 601 487 000 $ US | 7 560 497 000 $ US |
| 2001 | 1 096 255 000 $ US | 5 999 962 000 $ US |
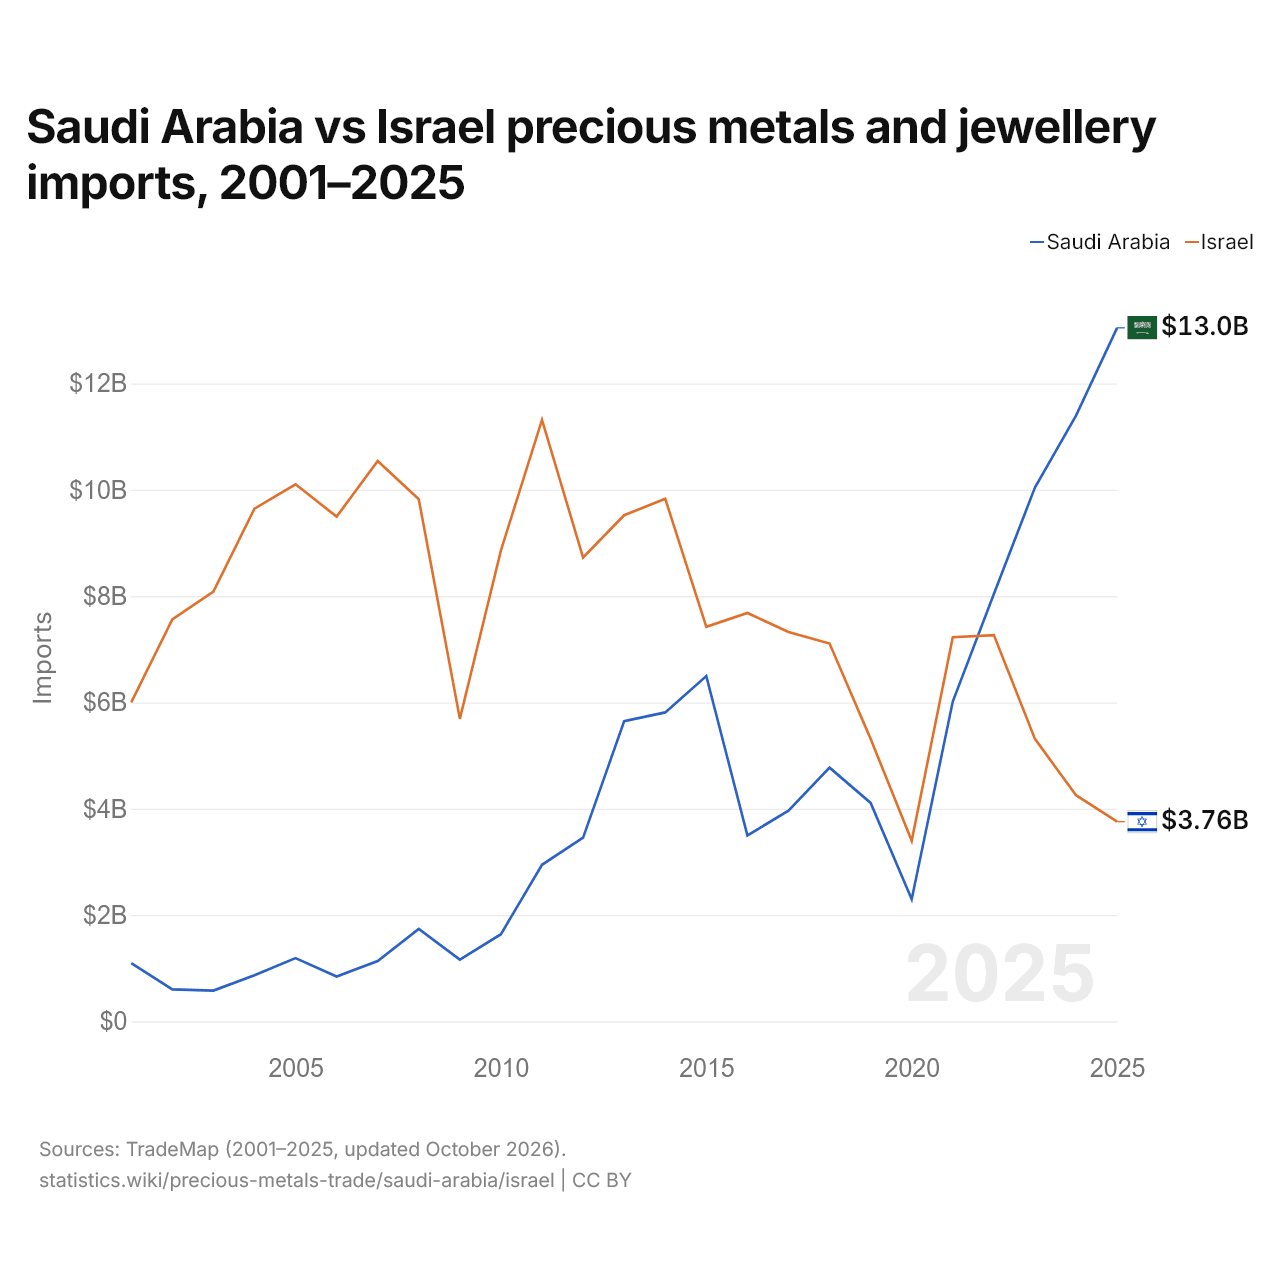
En 2025, les importations de métaux précieux et bijoux de l'Arabie saoudite s'élevaient à 13 milliards de dollars et celles d'Israël à 3,76 milliards de dollars : celles de l'Arabie saoudite étaient 3,5 fois plus élevées. En 2001, les importations d'Israël étaient 5,5 fois plus élevées : 1,1 milliard de dollars pour l'Arabie saoudite et 6 milliards de dollars pour Israël.
Arabie saoudite vs Israël : chiffres du commerce de métaux précieux et bijoux
|
Arabie saoudite
|
Israël
|
|
|---|---|---|
| Exportations | 5,14 Md $US (2025) | 5,05 Md $US (2025) |
| Importations | 13,0 Md $US (2025) | 3,76 Md $US (2025) |
| Solde | −7,91 Md $US (2025) | +1,29 Md $US (2025) |
| Part mondiale | 0,39 % | 0,39 % |
| Rang mondial | 31/171 | 33/171 |
| Premier acheteur | Émirats arabes unis (30,1 %, 2025) | États-Unis (45,4 %, 2025) |
| Premier fournisseur | Émirats arabes unis (42,2 %, 2025) | Inde (19,3 %, 2025) |
Comparer le commerce de métaux précieux et bijoux de 2 pays au choix
Sources :
- TradeMap (2001–2025, mis à jour en octobre 2026)
Creative Commons Attribution (CC BY) : vous pouvez copier, partager, adapter et réutiliser ce contenu, y compris à des fins commerciales, à condition de citer statistics.wiki et d’indiquer les modifications apportées. Les sources citées ci-dessus peuvent avoir leurs propres conditions de licence.