
Royaume-Uni vs Portugal : dépenses militaires ($ US), 1960–2025
| Année | $ US | |
|---|---|---|
 Royaume-Uni |
 Portugal |
|
| 2025 | 94 191 457 859 $ US | 5 931 729 151 $ US |
| 2024 | 90 049 917 899 $ US | 4 529 704 001 $ US |
| 2023 | 73 609 224 259 $ US | 3 531 855 845 $ US |
| 2022 | 63 999 220 561 $ US | 3 488 539 557 $ US |
| 2021 | 65 142 776 433 $ US | 3 881 044 054 $ US |
| 2020 | 58 332 403 452 $ US | 3 298 548 143 $ US |
| 2019 | 56 607 667 129 $ US | 3 301 778 119 $ US |
| 2018 | 55 834 812 244 $ US | 3 363 358 444 $ US |
| 2017 | 52 263 660 506 $ US | 3 223 432 269 $ US |
| 2016 | 53 365 076 946 $ US | 3 236 363 321 $ US |
| 2015 | 59 990 205 719 $ US | 3 134 862 102 $ US |
| 2014 | 66 948 107 043 $ US | 3 440 418 481 $ US |
| 2013 | 63 837 767 008 $ US | 3 807 448 795 $ US |
| 2012 | 65 452 488 707 $ US | 3 946 356 885 $ US |
| 2011 | 66 569 570 092 $ US | 3 847 642 710 $ US |
| 2010 | 63 979 077 809 $ US | 3 809 844 557 $ US |
| 2009 | 64 012 401 357 $ US | 3 787 950 101 $ US |
| 2008 | 72 910 850 458 $ US | 3 729 835 869 $ US |
| 2007 | 73 443 917 278 $ US | 3 313 815 899 $ US |
| 2006 | 64 216 083 503 $ US | 3 156 575 442 $ US |
| 2005 | 61 653 410 844 $ US | 3 143 816 118 $ US |
| 2004 | 60 248 576 365 $ US | 2 852 268 012 $ US |
| 2003 | 52 340 729 449 $ US | 2 368 649 861 $ US |
| 2002 | 44 246 791 241 $ US | 1 974 502 384 $ US |
| 2001 | 39 510 020 470 $ US | 1 757 254 567 $ US |
| 2000 | 39 345 556 718 $ US | 1 668 817 718 $ US |
| 1999 | 40 757 565 046 $ US | 1 818 071 791 $ US |
| 1998 | 41 223 764 341 $ US | 1 763 779 417 $ US |
| 1997 | 39 892 298 526 $ US | 1 803 865 596 $ US |
| 1996 | 38 563 607 691 $ US | 1 964 092 952 $ US |
| 1995 | 38 292 349 331 $ US | 2 016 529 150 $ US |
| 1994 | 38 570 607 266 $ US | 1 675 978 156 $ US |
| 1993 | 38 110 748 981 $ US | 1 697 355 931 $ US |
| 1992 | 45 590 511 426 $ US | 1 942 300 007 $ US |
| 1991 | 47 046 701 916 $ US | 1 632 934 517 $ US |
| 1990 | 43 543 316 543 $ US | 1 448 986 877 $ US |
| 1989 | 37 454 992 152 $ US | 1 143 715 092 $ US |
| 1988 | 38 355 189 703 $ US | 1 062 385 978 $ US |
| 1987 | 34 923 300 808 $ US | 895 866 142 $ US |
| 1986 | 30 432 444 111 $ US | 742 303 840 $ US |
| 1985 | 26 033 418 336 $ US | 499 891 677 $ US |
| 1984 | 25 419 076 211 $ US | 469 387 961 $ US |
| 1983 | 26 424 123 730 $ US | 520 080 316 $ US |
| 1982 | 27 716 463 959 $ US | 621 280 577 $ US |
| 1981 | 26 950 481 636 $ US | 640 400 558 $ US |
| 1980 | 28 359 829 680 $ US | 666 721 962 $ US |
| 1979 | 20 543 858 226 $ US | 540 076 076 $ US |
| 1978 | 15 897 488 515 $ US | 491 803 631 $ US |
| 1977 | 12 951 492 023 $ US | 443 842 908 $ US |
| 1976 | 12 038 974 069 $ US | 479 518 714 $ US |
| 1975 | 12 908 845 713 $ US | 598 829 369 $ US |
| 1974 | 10 449 679 553 $ US | 760 437 048 $ US |
| 1973 | 9 446 222 983 $ US | 525 085 622 $ US |
| 1972 | 8 788 973 126 $ US | 456 425 548 $ US |
| 1971 | 7 518 751 075 $ US | 398 591 949 $ US |
| 1970 | 6 791 561 033 $ US | 335 509 119 $ US |
| 1969 | 6 408 115 799 $ US | 301 633 114 $ US |
| 1968 | 6 402 129 621 $ US | 299 198 281 $ US |
| 1967 | 7 053 633 997 $ US | 267 943 783 $ US |
| 1966 | 6 784 751 230 $ US | 206 904 664 $ US |
| 1965 | 6 554 437 667 $ US | 186 932 305 $ US |
| 1964 | 6 227 175 429 $ US | 182 106 546 $ US |
| 1963 | 5 886 856 914 $ US | 161 564 384 $ US |
| 1962 | 5 641 965 759 $ US | 162 130 284 $ US |
| 1961 | 5 380 822 714 $ US | 138 928 393 $ US |
| 1960 | 5 194 109 177 $ US | 85 337 685 $ US |
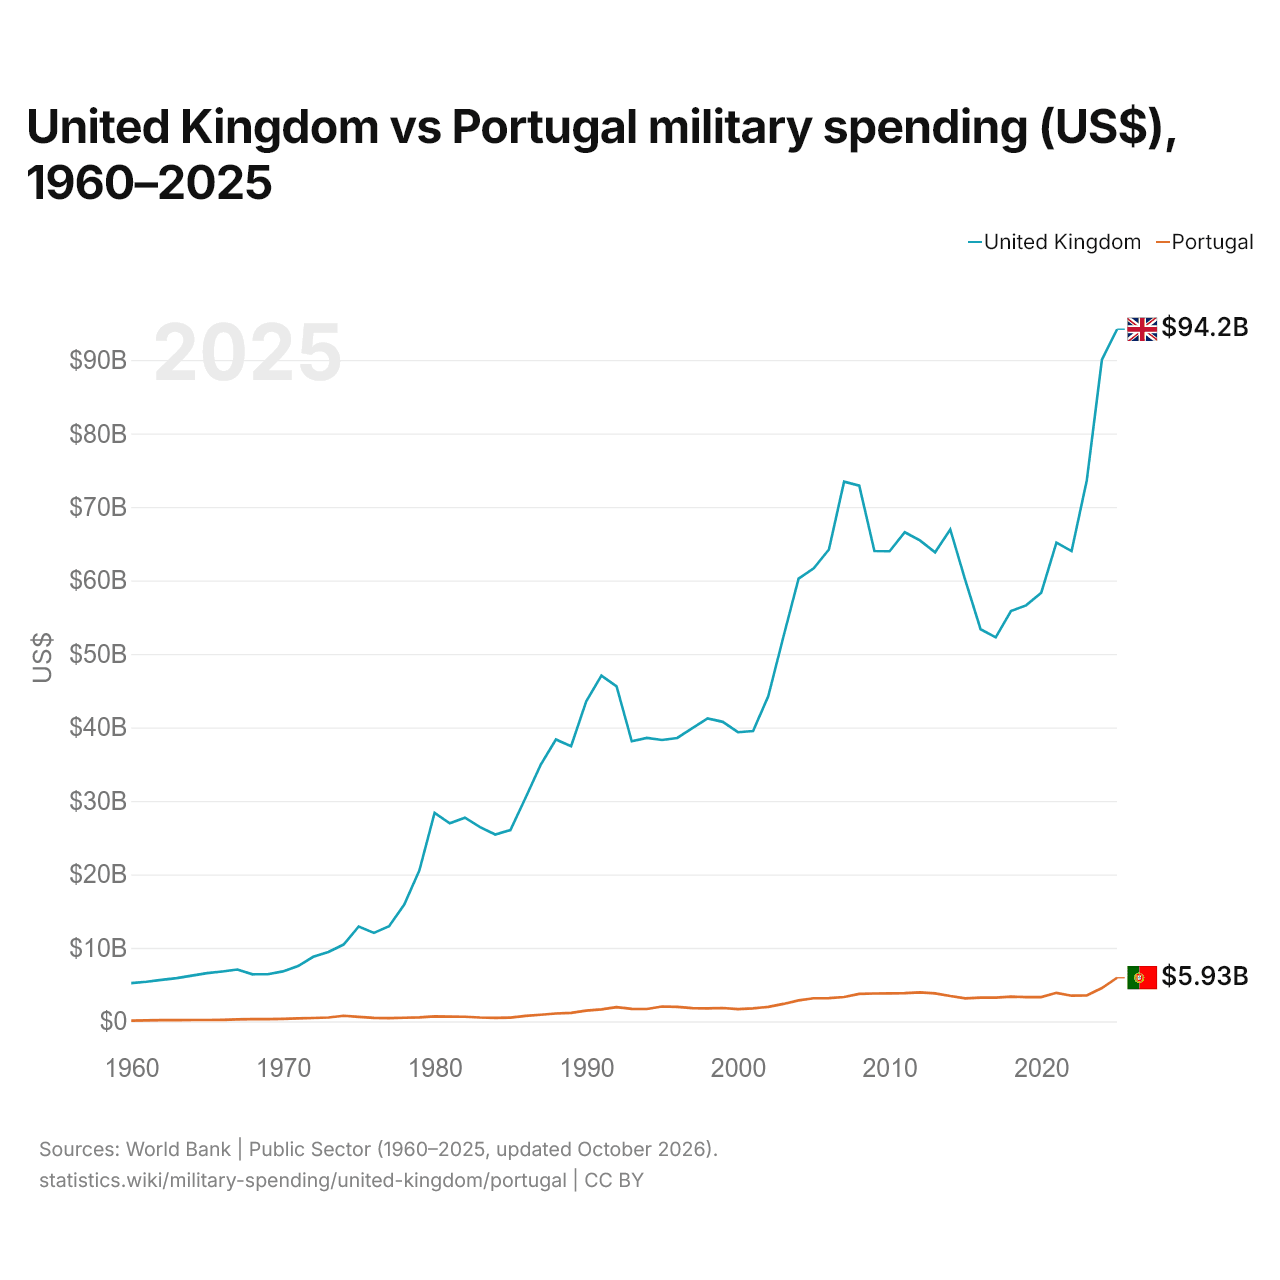
En 2025, les dépenses militaires s'élevaient à 94,2 milliards de dollars au Royaume-Uni et à 5,93 milliards de dollars au Portugal : 16 fois plus au Royaume-Uni. En 1960, elles s'élevaient à 5,19 milliards de dollars au Royaume-Uni et à 85,3 millions de dollars au Portugal, soit 61 fois plus au Royaume-Uni.
Royaume-Uni vs Portugal : dépenses militaires en % du PIB, 1960–2025
| Année | % du PIB | |
|---|---|---|
|
Royaume-Uni
|
Portugal
|
|
| 2025 | 2,4 % | 1,7 % |
| 2024 | 2,4 % | 1,4 % |
| 2023 | 2,2 % | 1,2 % |
| 2022 | 2 % | 1,4 % |
| 2021 | 2 % | 1,5 % |
| 2020 | 2,1 % | 1,4 % |
| 2019 | 2 % | 1,4 % |
| 2018 | 1,9 % | 1,4 % |
| 2017 | 1,9 % | 1,5 % |
| 2016 | 2 % | 1,6 % |
| 2015 | 2 % | 1,6 % |
| 2014 | 2,2 % | 1,5 % |
| 2013 | 2,3 % | 1,7 % |
| 2012 | 2,4 % | 1,8 % |
| 2011 | 2,5 % | 1,6 % |
| 2010 | 2,6 % | 1,6 % |
| 2009 | 2,6 % | 1,5 % |
| 2008 | 2,5 % | 1,4 % |
| 2007 | 2,4 % | 1,4 % |
| 2006 | 2,4 % | 1,5 % |
| 2005 | 2,4 % | 1,6 % |
| 2004 | 2,5 % | 1,5 % |
| 2003 | 2,5 % | 1,4 % |
| 2002 | 2,5 % | 1,5 % |
| 2001 | 2,4 % | 1,4 % |
| 2000 | 2,4 % | 1,4 % |
| 1999 | 2,4 % | 1,4 % |
| 1998 | 2,5 % | 1,4 % |
| 1997 | 2,5 % | 1,5 % |
| 1996 | 2,7 % | 1,6 % |
| 1995 | 2,8 % | 1,7 % |
| 1994 | 3,4 % | 1,7 % |
| 1993 | 3,6 % | 1,8 % |
| 1992 | 3,9 % | 1,8 % |
| 1991 | 4,1 % | 1,8 % |
| 1990 | 4 % | 1,8 % |
| 1989 | 4 % | 1,9 % |
| 1988 | 4,2 % | 1,9 % |
| 1987 | 4,7 % | 1,9 % |
| 1986 | 5,1 % | 1,9 % |
| 1985 | 5,3 % | 1,8 % |
| 1984 | 5,5 % | 1,9 % |
| 1983 | 5,4 % | 1,9 % |
| 1982 | 5,4 % | 2 % |
| 1981 | 5 % | 2 % |
| 1980 | 5 % | 2 % |
| 1979 | 4,7 % | 2 % |
| 1978 | 4,7 % | 2,1 % |
| 1977 | 4,9 % | 2,1 % |
| 1976 | 5,2 % | 2,4 % |
| 1975 | 5,3 % | 3,1 % |
| 1974 | 5,1 % | 4,3 % |
| 1973 | 4,9 % | 3,5 % |
| 1972 | 5,2 % | 4,1 % |
| 1971 | 5,1 % | 4,3 % |
| 1970 | 5,2 % | 4,1 % |
| 1969 | 5,5 % | 4,1 % |
| 1968 | 5,9 % | 4,5 % |
| 1967 | 6,2 % | 4,5 % |
| 1966 | 6,2 % | 3,9 % |
| 1965 | 6,4 % | 3,8 % |
| 1964 | 6,6 % | 4,1 % |
| 1963 | 6,8 % | 4 % |
| 1962 | 6,9 % | 4,2 % |
| 1961 | 6,9 % | 3,9 % |
| 1960 | 7,1 % | 2,6 % |
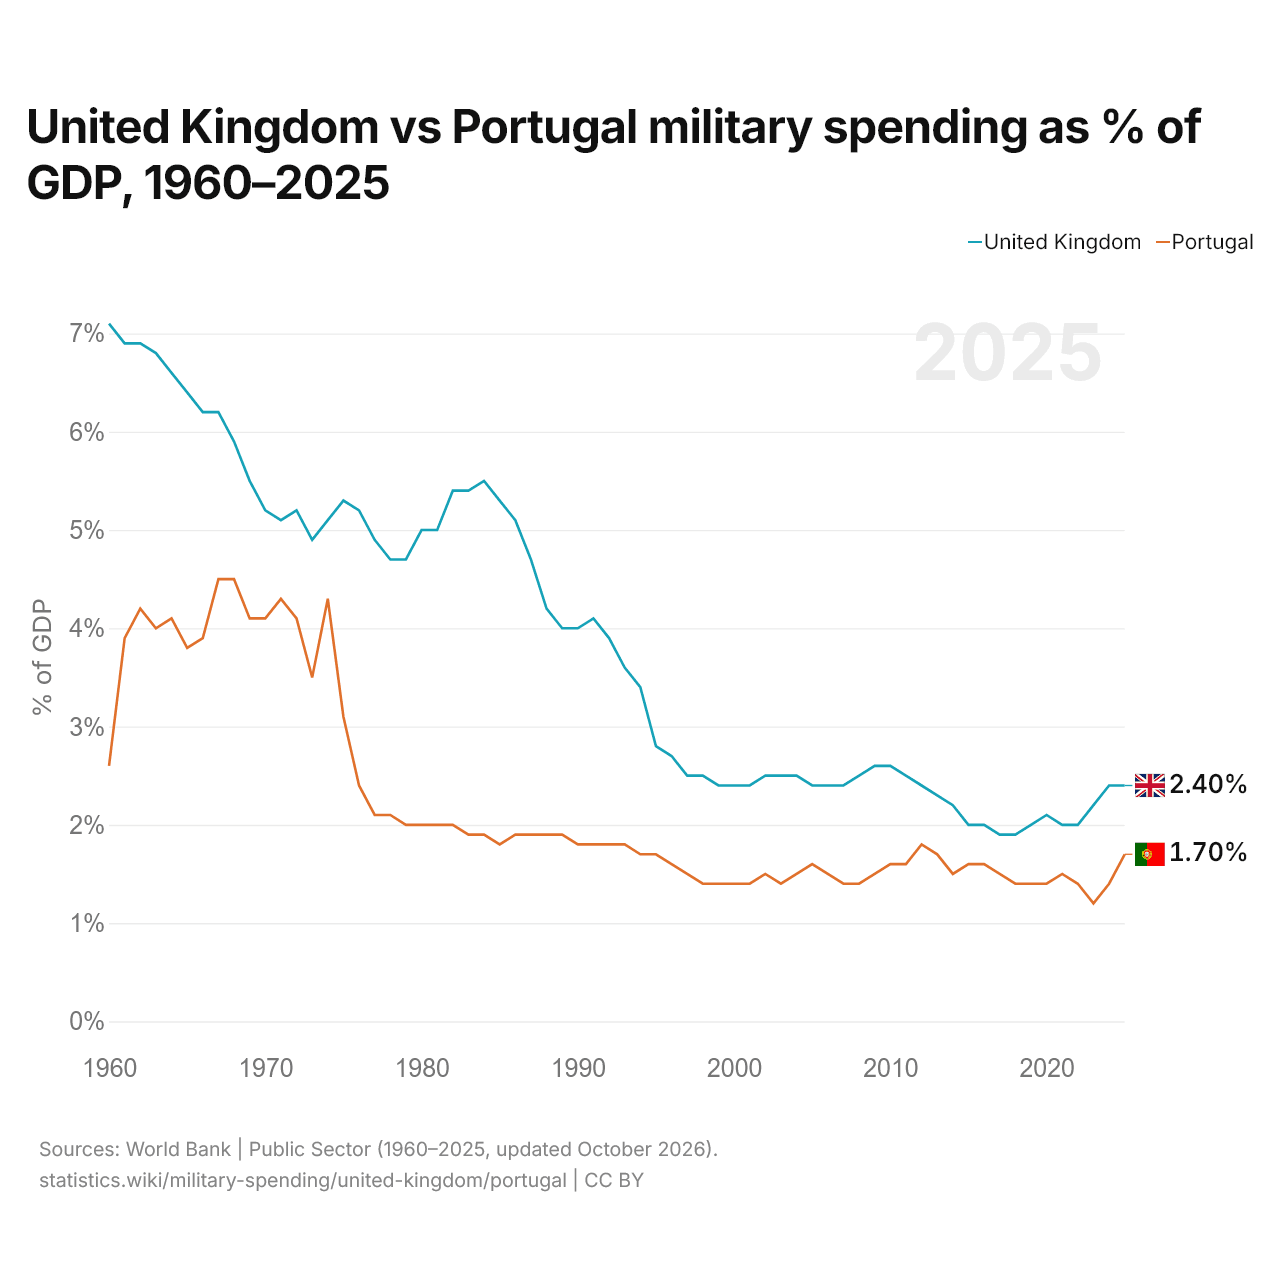
En 2025, les dépenses militaires représentaient 2,4 % du PIB au Royaume-Uni et 1,7 % au Portugal : 0,7 points de pourcentage de plus au Royaume-Uni. En 2015, elles représentaient 2,0 % au Royaume-Uni et 1,6 % au Portugal, soit 0,4 points de pourcentage de plus au Royaume-Uni.
Les dépenses militaires du Royaume-Uni, en part du PIB, sont supérieures à celles du Portugal chaque année depuis 1960.
Royaume-Uni vs Portugal : chiffres des dépenses militaires
|
Royaume-Uni
|
Portugal
|
|
|---|---|---|
| $ US, 2025 | 94,2 Md $US | 5,93 Md $US |
| % du PIB, 2025 | 2,4 % | 1,7 % |
| Par personne, $ US | 1 356 $US | 549 $US |
| Part mondiale | 3,3 % | 0,21 % |
| Rang mondial | 5/154 | 46/154 |
Comparer les dépenses militaires de 2 pays au choix
Sources :
- Banque mondiale | Secteur public (1960–2025, mis à jour en octobre 2026)
Creative Commons Attribution (CC BY) : vous pouvez copier, partager, adapter et réutiliser ce contenu, y compris à des fins commerciales, à condition de citer statistics.wiki et d’indiquer les modifications apportées. Les sources citées ci-dessus peuvent avoir leurs propres conditions de licence.