
Suisse vs Canada : dépenses militaires ($ US), 1960–2025
| Année | $ US | |
|---|---|---|
 Suisse |
 Canada |
|
| 2025 | 7 898 733 872 $ US | 37 755 148 445 $ US |
| 2024 | 6 769 059 409 $ US | 30 617 562 312 $ US |
| 2023 | 6 551 587 284 $ US | 28 878 130 615 $ US |
| 2022 | 5 855 353 316 $ US | 25 122 688 854 $ US |
| 2021 | 5 657 074 474 $ US | 24 700 900 147 $ US |
| 2020 | 5 841 288 886 $ US | 23 455 267 772 $ US |
| 2019 | 5 127 626 237 $ US | 21 280 025 307 $ US |
| 2018 | 4 836 291 121 $ US | 21 591 227 997 $ US |
| 2017 | 4 704 129 442 $ US | 21 397 253 378 $ US |
| 2016 | 4 643 998 531 $ US | 17 466 505 850 $ US |
| 2015 | 4 599 764 271 $ US | 18 226 047 041 $ US |
| 2014 | 4 705 664 077 $ US | 19 710 299 566 $ US |
| 2013 | 5 122 061 606 $ US | 18 509 550 656 $ US |
| 2012 | 4 668 846 107 $ US | 20 448 456 461 $ US |
| 2011 | 5 052 676 387 $ US | 21 399 729 900 $ US |
| 2010 | 4 192 040 219 $ US | 19 316 621 467 $ US |
| 2009 | 4 124 823 312 $ US | 18 936 262 205 $ US |
| 2008 | 4 152 146 421 $ US | 19 342 818 525 $ US |
| 2007 | 3 583 935 091 $ US | 17 417 128 892 $ US |
| 2006 | 3 379 810 983 $ US | 14 809 370 592 $ US |
| 2005 | 3 536 448 872 $ US | 12 987 658 561 $ US |
| 2004 | 3 635 818 311 $ US | 11 336 613 181 $ US |
| 2003 | 3 396 693 092 $ US | 9 957 866 421 $ US |
| 2002 | 3 002 399 145 $ US | 8 495 471 966 $ US |
| 2001 | 2 878 040 651 $ US | 8 375 296 572 $ US |
| 2000 | 2 905 939 300 $ US | 8 299 381 087 $ US |
| 1999 | 3 279 397 044 $ US | 8 423 890 101 $ US |
| 1998 | 3 637 482 521 $ US | 7 964 894 868 $ US |
| 1997 | 3 648 775 187 $ US | 8 162 739 957 $ US |
| 1996 | 4 433 757 687 $ US | 8 852 175 994 $ US |
| 1995 | 4 855 870 843 $ US | 9 417 181 135 $ US |
| 1994 | 4 075 674 629 $ US | 9 839 801 236 $ US |
| 1993 | 3 777 465 775 $ US | 10 548 928 550 $ US |
| 1992 | 4 329 458 815 $ US | 11 065 636 340 $ US |
| 1991 | 4 197 549 090 $ US | 11 610 121 845 $ US |
| 1990 | 4 241 153 775 $ US | 11 675 891 382 $ US |
| 1989 | 3 219 672 748 $ US | 10 973 364 382 $ US |
| 1988 | 3 423 614 029 $ US | 10 120 194 899 $ US |
| 1987 | 3 158 695 538 $ US | 8 933 724 454 $ US |
| 1986 | 2 682 337 360 $ US | 7 994 001 282 $ US |
| 1985 | 2 055 878 686 $ US | 7 680 298 397 $ US |
| 1984 | 1 890 165 834 $ US | 7 552 402 213 $ US |
| 1983 | 2 034 940 418 $ US | 7 114 908 137 $ US |
| 1982 | 2 018 131 967 $ US | 6 149 299 241 $ US |
| 1981 | 1 894 533 148 $ US | 5 253 658 392 $ US |
| 1980 | 2 088 263 917 $ US | 4 848 291 313 $ US |
| 1979 | 2 380 497 419 $ US | 4 173 576 909 $ US |
| 1978 | 2 042 550 959 $ US | 4 055 895 830 $ US |
| 1977 | 1 501 152 963 $ US | 3 834 090 748 $ US |
| 1976 | 1 503 174 691 $ US | 3 660 267 397 $ US |
| 1975 | 1 263 098 838 $ US | 3 250 385 174 $ US |
| 1974 | 1 087 379 901 $ US | 2 871 032 678 $ US |
| 1973 | 936 246 304 $ US | 2 414 715 755 $ US |
| 1972 | 736 069 493 $ US | 2 282 686 632 $ US |
| 1971 | 625 873 569 $ US | 2 123 097 279 $ US |
| 1970 | 533 719 182 $ US | 1 930 510 613 $ US |
| 1969 | 500 691 676 $ US | 1 805 498 970 $ US |
| 1968 | 457 595 487 $ US | 1 832 664 291 $ US |
| 1967 | 469 073 437 $ US | 1 809 700 056 $ US |
| 1966 | 462 905 597 $ US | 1 643 575 295 $ US |
| 1965 | 420 369 459 $ US | 1 601 370 176 $ US |
| 1964 | 407 555 522 $ US | 1 684 145 750 $ US |
| 1963 | 364 846 405 $ US | 1 634 373 692 $ US |
| 1962 | 338 543 661 $ US | 1 693 116 711 $ US |
| 1961 | 293 569 608 $ US | 1 694 184 739 $ US |
| 1960 | 247 470 928 $ US | 1 697 697 793 $ US |
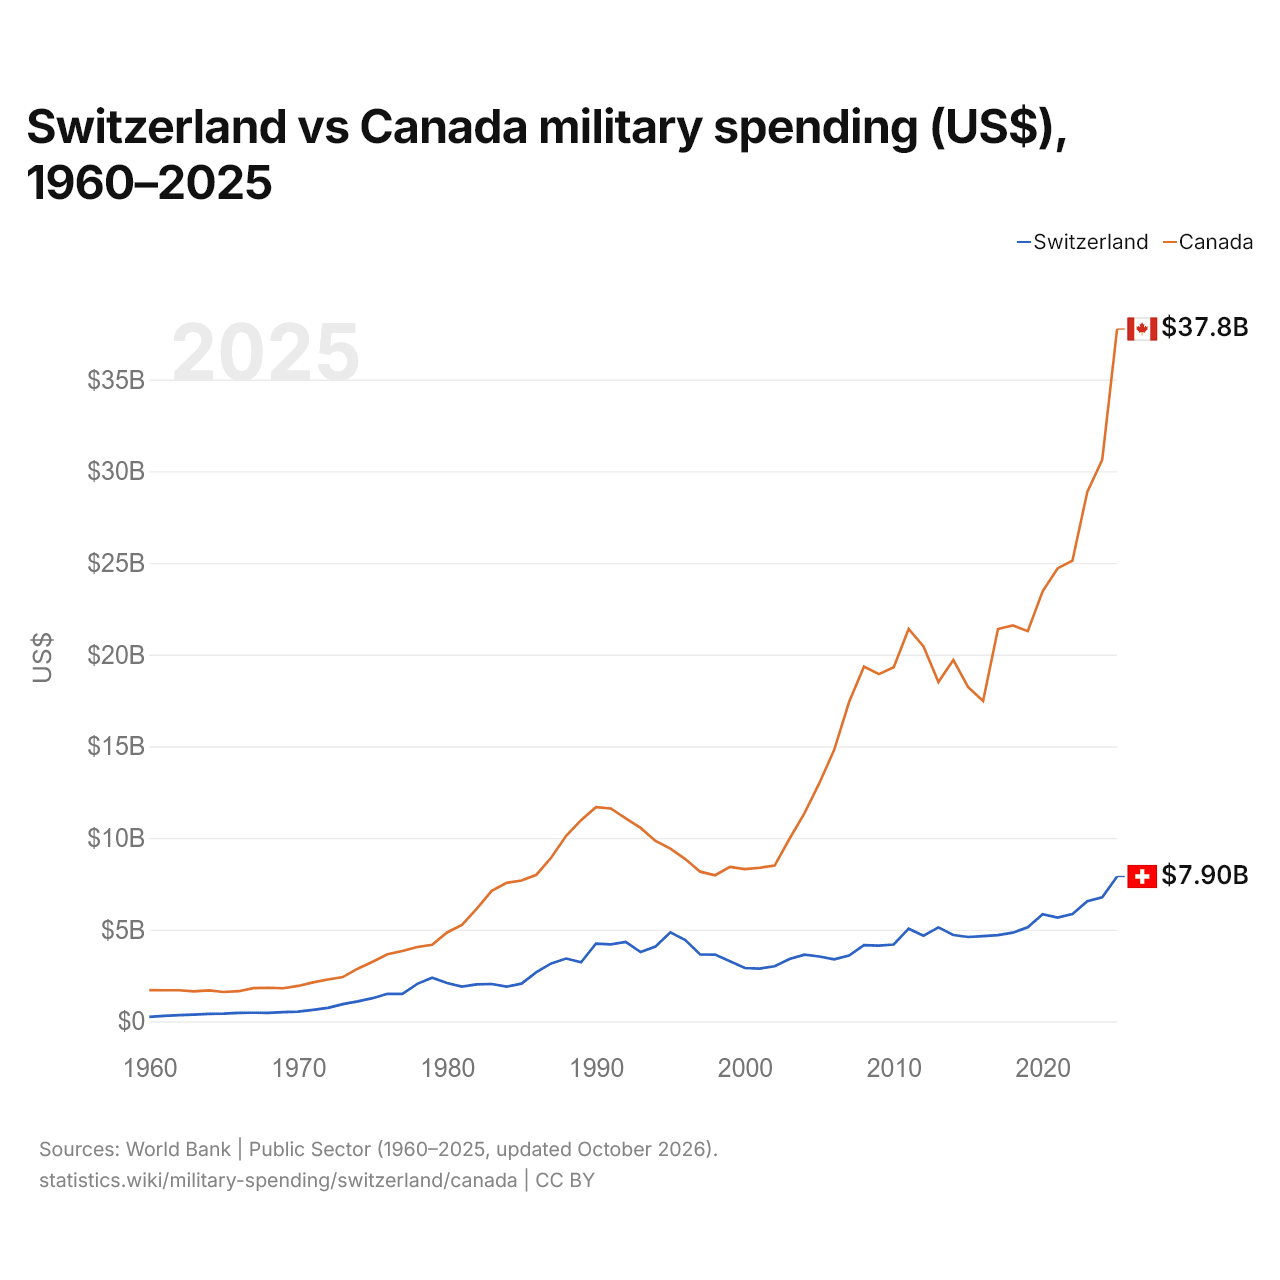
En 2025, les dépenses militaires s'élevaient à 7,9 milliards de dollars en Suisse et à 37,8 milliards de dollars au Canada : 4,8 fois plus au Canada. En 1960, elles s'élevaient à 247 millions de dollars en Suisse et à 1,7 milliard de dollars au Canada, soit 6,9 fois plus au Canada.
Suisse vs Canada : dépenses militaires en % du PIB, 1960–2025
| Année | % du PIB | |
|---|---|---|
|
Suisse
|
Canada
|
|
| 2025 | 0,8 % | 1,6 % |
| 2024 | 0,7 % | 1,3 % |
| 2023 | 0,7 % | 1,3 % |
| 2022 | 0,7 % | 1,1 % |
| 2021 | 0,7 % | 1,2 % |
| 2020 | 0,8 % | 1,4 % |
| 2019 | 0,7 % | 1,2 % |
| 2018 | 0,7 % | 1,3 % |
| 2017 | 0,7 % | 1,3 % |
| 2016 | 0,7 % | 1,1 % |
| 2015 | 0,7 % | 1,2 % |
| 2014 | 0,6 % | 1,1 % |
| 2013 | 0,7 % | 1 % |
| 2012 | 0,7 % | 1,1 % |
| 2011 | 0,7 % | 1,2 % |
| 2010 | 0,7 % | 1,2 % |
| 2009 | 0,7 % | 1,4 % |
| 2008 | 0,7 % | 1,2 % |
| 2007 | 0,7 % | 1,2 % |
| 2006 | 0,8 % | 1,1 % |
| 2005 | 0,8 % | 1,1 % |
| 2004 | 0,9 % | 1,1 % |
| 2003 | 0,9 % | 1,1 % |
| 2002 | 1 % | 1,1 % |
| 2001 | 1 % | 1,1 % |
| 2000 | 1 % | 1,1 % |
| 1999 | 1,1 % | 1,2 % |
| 1998 | 1,2 % | 1,3 % |
| 1997 | 1,2 % | 1,2 % |
| 1996 | 1,3 % | 1,4 % |
| 1995 | 1,4 % | 1,6 % |
| 1994 | 1,3 % | 1,7 % |
| 1993 | 1,4 % | 1,8 % |
| 1992 | 1,5 % | 1,9 % |
| 1991 | 1,5 % | 1,9 % |
| 1990 | 1,6 % | 2 % |
| 1989 | 1,5 % | 1,9 % |
| 1988 | 1,6 % | 2 % |
| 1987 | 1,6 % | 2,1 % |
| 1986 | 1,7 % | 2,1 % |
| 1985 | 1,8 % | 2,1 % |
| 1984 | 1,7 % | 2,1 % |
| 1983 | 1,7 % | 2,1 % |
| 1982 | 1,7 % | 2 % |
| 1981 | 1,7 % | 1,7 % |
| 1980 | 1,7 % | 1,8 % |
| 1979 | 2 % | 1,7 % |
| 1978 | 2 % | 1,8 % |
| 1977 | 2 % | 1,8 % |
| 1976 | 2,2 % | 1,8 % |
| 1975 | 1,9 % | 1,9 % |
| 1974 | 1,9 % | 1,8 % |
| 1973 | 1,9 % | 1,8 % |
| 1972 | 2 % | 2 % |
| 1971 | 2,1 % | 2,1 % |
| 1970 | 2,1 % | 2,2 % |
| 1969 | 2,2 % | 2,3 % |
| 1968 | 2,2 % | 2,5 % |
| 1967 | 2,4 % | 2,7 % |
| 1966 | 2,5 % | 2,7 % |
| 1965 | 2,5 % | 2,9 % |
| 1964 | 2,5 % | 3,4 % |
| 1963 | 2,5 % | 3,6 % |
| 1962 | 2,6 % | 4 % |
| 1961 | 2,5 % | 4,1 % |
| 1960 | 2,3 % | 4,2 % |
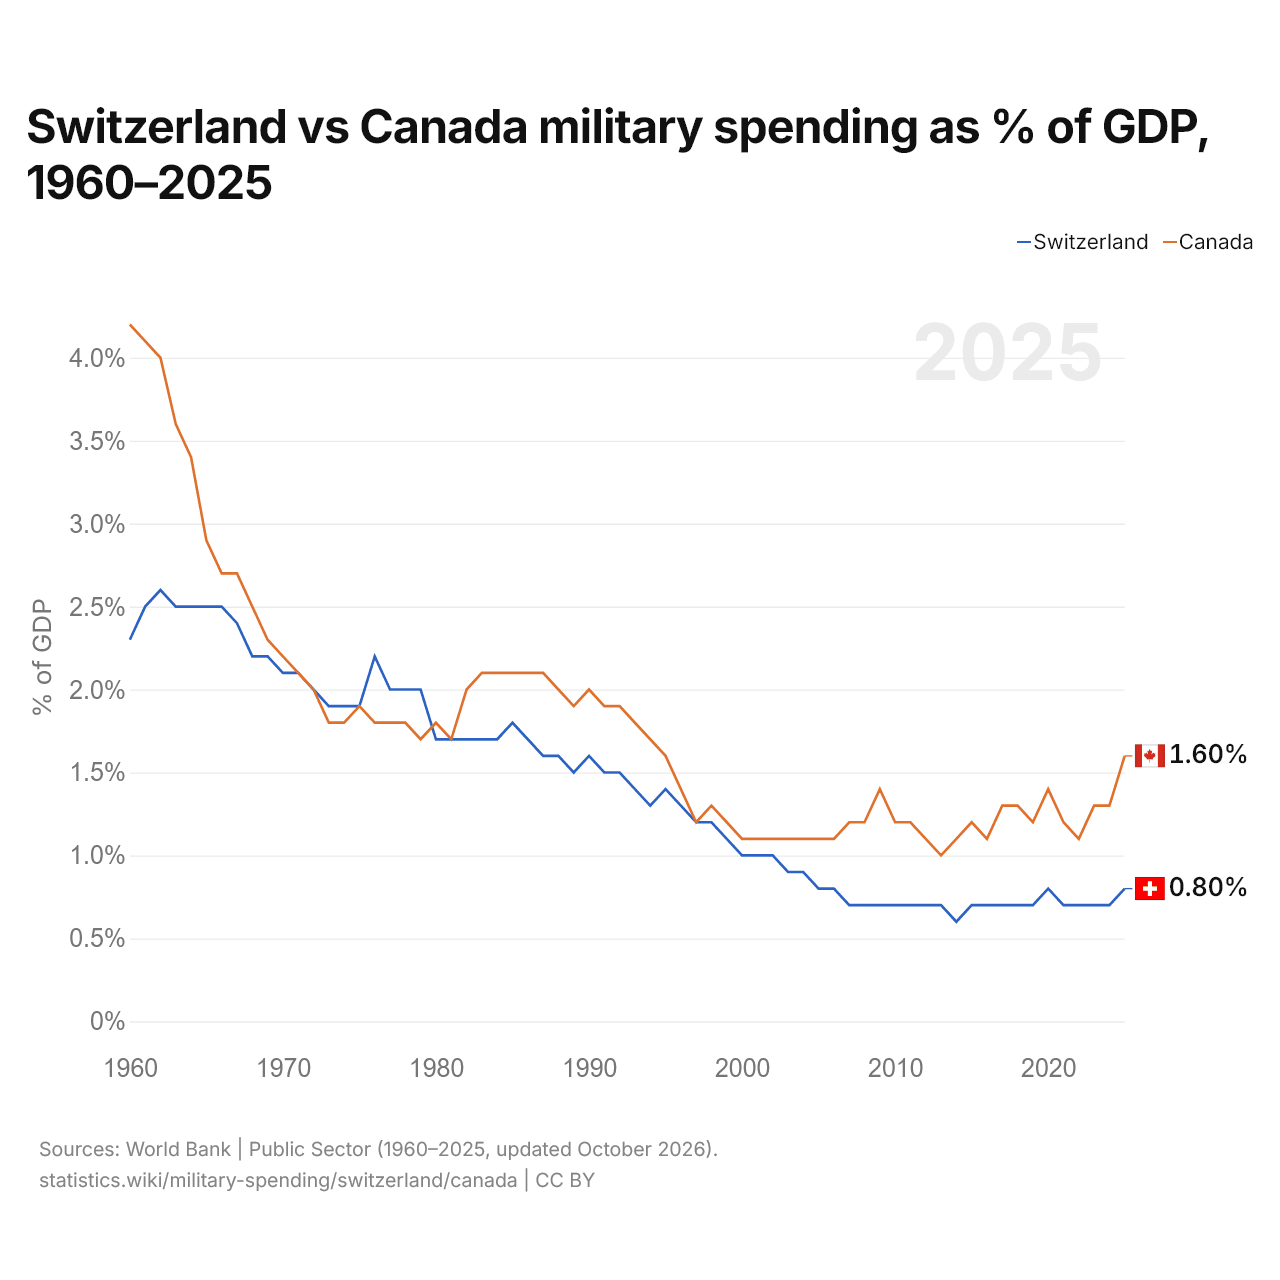
En 2025, les dépenses militaires représentaient 0,8 % du PIB en Suisse et 1,6 % au Canada : 0,8 points de pourcentage de plus au Canada. En 2015, elles représentaient 0,7 % en Suisse et 1,2 % au Canada, soit 0,5 points de pourcentage de plus au Canada.
Les dépenses militaires du Canada, en part du PIB, sont supérieures à celles de la Suisse chaque année depuis 1998.
Suisse vs Canada : chiffres des dépenses militaires
|
Suisse
|
Canada
|
|
|---|---|---|
| $ US, 2025 | 7,90 Md $US | 37,8 Md $US |
| % du PIB, 2025 | 0,8 % | 1,6 % |
| Par personne, $ US | 869 $US | 906 $US |
| Part mondiale | 0,28 % | 1,32 % |
| Rang mondial | 36/154 | 16/154 |
Comparer les dépenses militaires de 2 pays au choix
Sources :
- Banque mondiale | Secteur public (1960–2025, mis à jour en octobre 2026)
Creative Commons Attribution (CC BY) : vous pouvez copier, partager, adapter et réutiliser ce contenu, y compris à des fins commerciales, à condition de citer statistics.wiki et d’indiquer les modifications apportées. Les sources citées ci-dessus peuvent avoir leurs propres conditions de licence.