
Pologne vs Finlande : dépenses militaires ($ US), 1960–2025
| Année | $ US | |
|---|---|---|
 Pologne |
 Finlande |
|
| 2025 | 46 565 419 128 $ US | 8 151 621 654 $ US |
| 2024 | 34 459 549 419 $ US | 6 503 657 452 $ US |
| 2023 | 26 459 281 580 $ US | 5 930 241 624 $ US |
| 2022 | 15 335 286 233 $ US | 4 454 922 264 $ US |
| 2021 | 15 280 029 346 $ US | 3 832 078 605 $ US |
| 2020 | 13 712 164 695 $ US | 3 876 613 594 $ US |
| 2019 | 11 772 723 425 $ US | 3 634 933 733 $ US |
| 2018 | 12 039 370 748 $ US | 3 756 616 296 $ US |
| 2017 | 9 976 892 748 $ US | 3 454 565 038 $ US |
| 2016 | 9 161 802 717 $ US | 3 418 116 812 $ US |
| 2015 | 10 212 785 780 $ US | 3 400 657 010 $ US |
| 2014 | 10 345 152 482 $ US | 3 990 816 356 $ US |
| 2013 | 9 275 720 532 $ US | 4 162 321 935 $ US |
| 2012 | 8 986 833 273 $ US | 3 943 016 434 $ US |
| 2011 | 9 455 429 370 $ US | 4 104 876 041 $ US |
| 2010 | 8 790 170 132 $ US | 3 720 807 509 $ US |
| 2009 | 7 903 806 942 $ US | 3 956 443 179 $ US |
| 2008 | 9 349 413 633 $ US | 3 974 140 756 $ US |
| 2007 | 8 589 136 365 $ US | 3 300 920 196 $ US |
| 2006 | 6 619 418 025 $ US | 3 131 299 671 $ US |
| 2005 | 5 896 399 394 $ US | 3 000 584 416 $ US |
| 2004 | 4 778 625 136 $ US | 2 898 132 074 $ US |
| 2003 | 4 150 267 094 $ US | 2 480 620 130 $ US |
| 2002 | 3 776 170 438 $ US | 1 619 011 333 $ US |
| 2001 | 3 630 645 595 $ US | 1 480 565 172 $ US |
| 2000 | 3 146 103 093 $ US | 1 562 013 543 $ US |
| 1999 | 3 226 556 978 $ US | 1 654 055 113 $ US |
| 1998 | 3 491 022 616 $ US | 1 960 521 758 $ US |
| 1997 | 3 192 274 430 $ US | 1 947 542 252 $ US |
| 1996 | 3 083 416 787 $ US | 2 020 100 580 $ US |
| 1995 | 2 719 359 270 $ US | 1 907 065 642 $ US |
| 1994 | 2 518 823 809 $ US | 1 811 479 152 $ US |
| 1993 | 2 371 485 457 $ US | 1 664 624 389 $ US |
| 1992 | 2 104 659 076 $ US | 2 146 243 827 $ US |
| 1991 | 1 925 182 017 $ US | 2 276 314 264 $ US |
| 1990 | 1 723 659 266 $ US | 2 211 300 042 $ US |
| 1989 | - | 1 825 700 310 $ US |
| 1988 | - | 1 753 011 829 $ US |
| 1987 | - | 1 506 732 200 $ US |
| 1986 | - | 1 267 273 988 $ US |
| 1985 | - | 936 481 356 $ US |
| 1984 | - | 848 072 833 $ US |
| 1983 | - | 929 070 468 $ US |
| 1982 | - | 867 637 306 $ US |
| 1981 | - | 810 506 704 $ US |
| 1980 | - | 896 456 619 $ US |
| 1979 | - | 657 703 881 $ US |
| 1978 | - | 518 307 742 $ US |
| 1977 | - | 470 832 055 $ US |
| 1976 | - | 426 861 219 $ US |
| 1975 | - | 444 533 897 $ US |
| 1974 | - | 315 652 567 $ US |
| 1973 | - | 283 095 365 $ US |
| 1972 | - | 225 715 515 $ US |
| 1971 | - | 181 544 161 $ US |
| 1970 | - | 156 276 780 $ US |
| 1969 | - | 146 299 650 $ US |
| 1968 | - | 156 492 350 $ US |
| 1967 | - | 152 961 943 $ US |
| 1966 | - | 159 502 746 $ US |
| 1965 | - | 156 016 224 $ US |
| 1964 | - | 145 934 113 $ US |
| 1963 | - | 134 108 189 $ US |
| 1962 | - | 161 039 340 $ US |
| 1961 | - | 109 885 067 $ US |
| 1960 | - | 93 396 201 $ US |
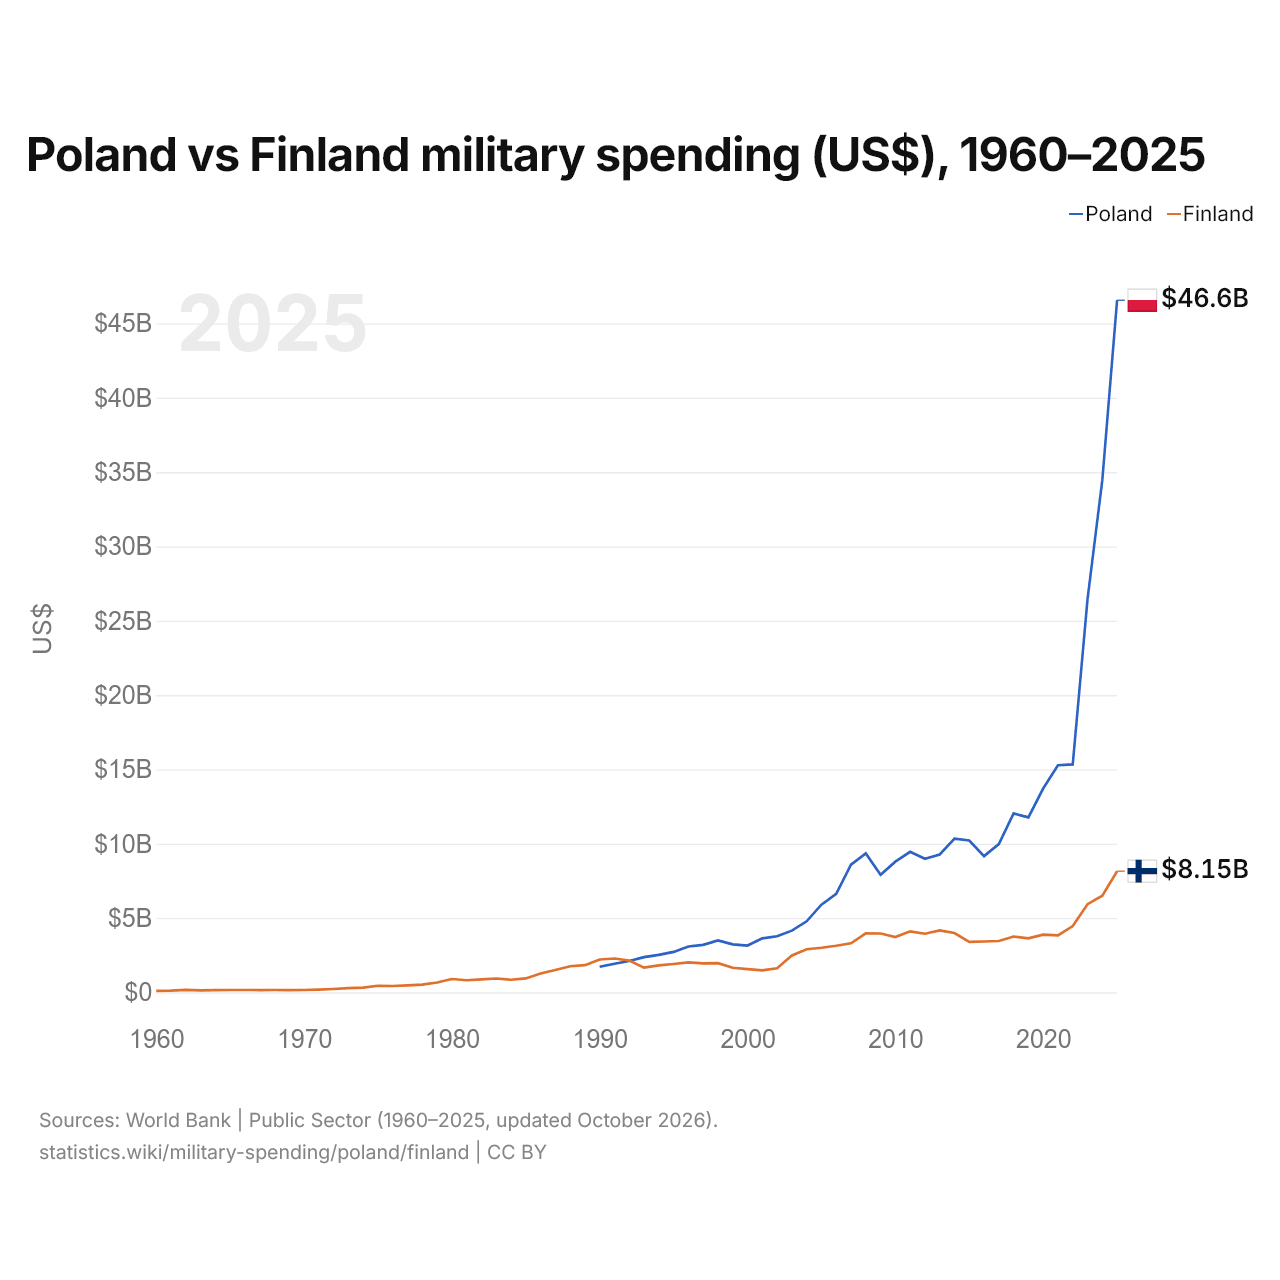
En 2025, les dépenses militaires s'élevaient à 46,6 milliards de dollars en Pologne et à 8,15 milliards de dollars en Finlande : 5,7 fois plus en Pologne. En 1990, elles s'élevaient à 1,72 milliard de dollars en Pologne et à 2,21 milliards de dollars en Finlande, soit 28 % de plus en Finlande.
Pologne vs Finlande : dépenses militaires en % du PIB, 1960–2025
| Année | % du PIB | |
|---|---|---|
|
Pologne
|
Finlande
|
|
| 2025 | 4,5 % | 2,6 % |
| 2024 | 3,8 % | 2,2 % |
| 2023 | 3,3 % | 2 % |
| 2022 | 2,2 % | 1,6 % |
| 2021 | 2,2 % | 1,3 % |
| 2020 | 2,3 % | 1,4 % |
| 2019 | 2 % | 1,4 % |
| 2018 | 2 % | 1,4 % |
| 2017 | 1,9 % | 1,4 % |
| 2016 | 1,9 % | 1,4 % |
| 2015 | 2,1 % | 1,5 % |
| 2014 | 1,9 % | 1,5 % |
| 2013 | 1,8 % | 1,5 % |
| 2012 | 1,8 % | 1,5 % |
| 2011 | 1,8 % | 1,5 % |
| 2010 | 1,8 % | 1,5 % |
| 2009 | 1,8 % | 1,6 % |
| 2008 | 1,7 % | 1,4 % |
| 2007 | 2 % | 1,3 % |
| 2006 | 1,9 % | 1,4 % |
| 2005 | 1,9 % | 1,5 % |
| 2004 | 1,9 % | 1,5 % |
| 2003 | 1,9 % | 1,4 % |
| 2002 | 1,9 % | 1,2 % |
| 2001 | 1,9 % | 1,1 % |
| 2000 | 1,8 % | 1,2 % |
| 1999 | 1,9 % | 1,2 % |
| 1998 | 2 % | 1,5 % |
| 1997 | 2 % | 1,5 % |
| 1996 | 1,9 % | 1,5 % |
| 1995 | 1,9 % | 1,4 % |
| 1994 | 2,3 % | 1,8 % |
| 1993 | 2,5 % | 1,9 % |
| 1992 | 2,2 % | 1,9 % |
| 1991 | 2,3 % | 1,8 % |
| 1990 | 2,6 % | 1,6 % |
| 1989 | 1,8 % | 1,5 % |
| 1988 | 2,6 % | 1,6 % |
| 1987 | 2,8 % | 1,6 % |
| 1986 | 2,9 % | 1,7 % |
| 1985 | 3 % | 1,7 % |
| 1984 | 3,1 % | 1,6 % |
| 1983 | 2,9 % | 1,8 % |
| 1982 | 3,2 % | 1,6 % |
| 1981 | 2,9 % | 1,5 % |
| 1980 | 2,7 % | 1,7 % |
| 1979 | - | 1,5 % |
| 1978 | - | 1,4 % |
| 1977 | - | 1,4 % |
| 1976 | - | 1,3 % |
| 1975 | - | 1,5 % |
| 1974 | - | 1,3 % |
| 1973 | - | 1,5 % |
| 1972 | - | 1,5 % |
| 1971 | - | 1,4 % |
| 1970 | - | 1,4 % |
| 1969 | - | 1,4 % |
| 1968 | - | 1,8 % |
| 1967 | - | 1,6 % |
| 1966 | - | 1,7 % |
| 1965 | - | 1,8 % |
| 1964 | - | 1,9 % |
| 1963 | - | 1,9 % |
| 1962 | - | 2,5 % |
| 1961 | - | 1,8 % |
| 1960 | - | 1,8 % |
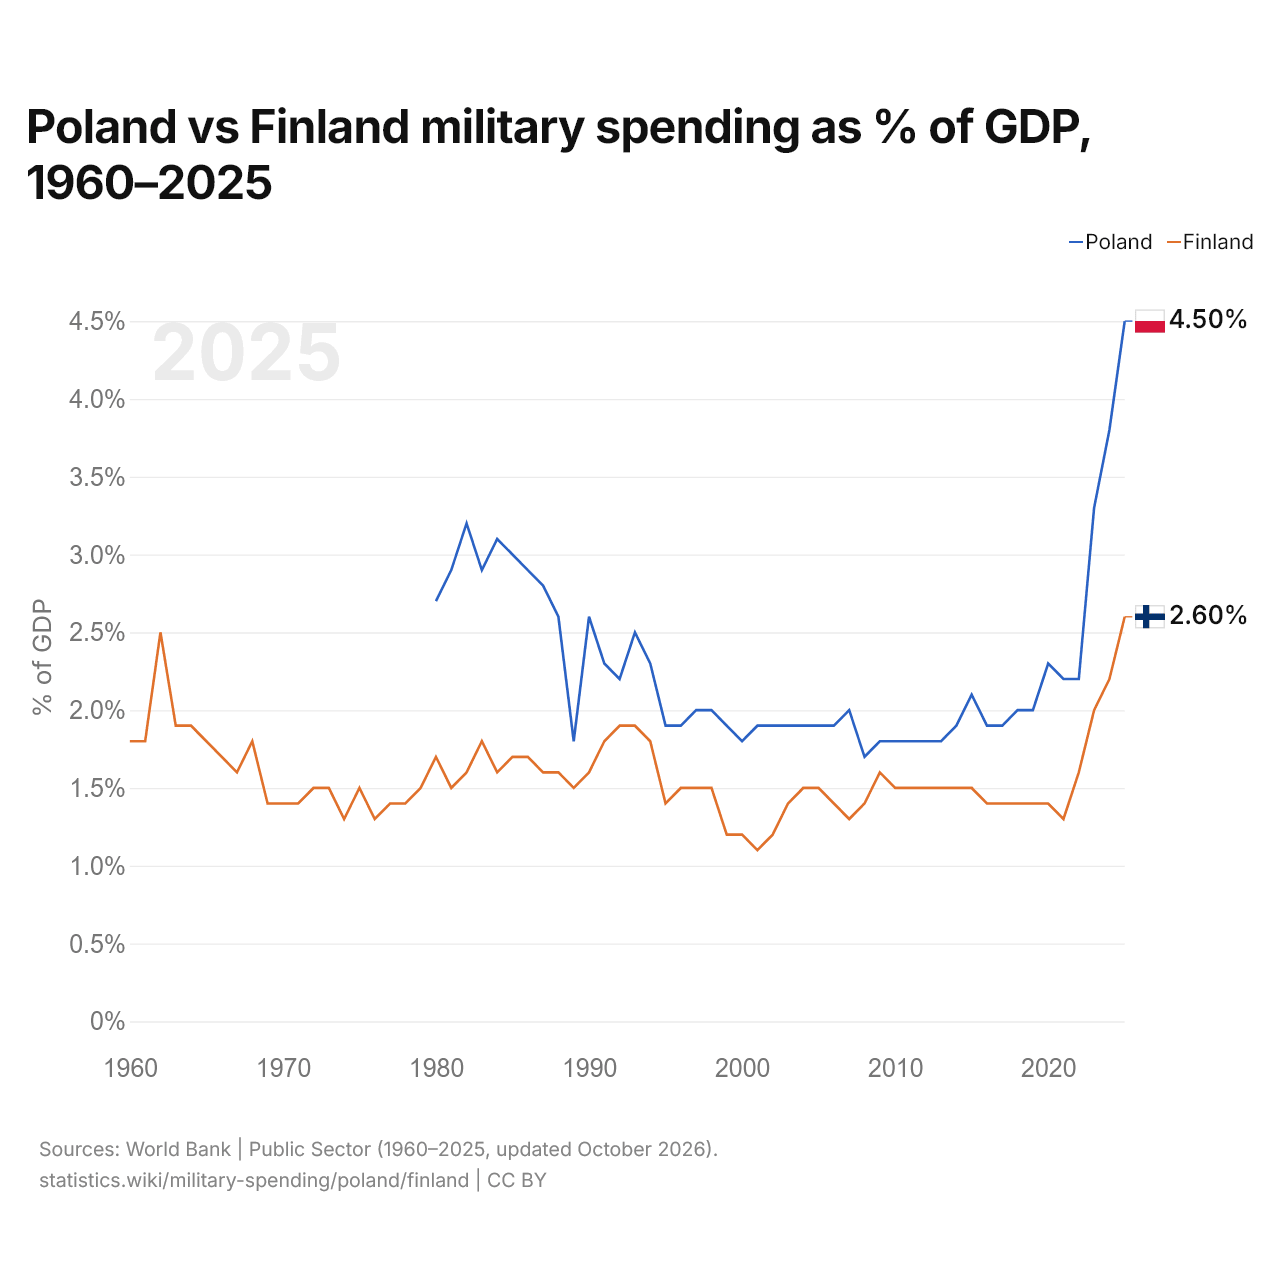
En 2025, les dépenses militaires représentaient 4,5 % du PIB en Pologne et 2,6 % en Finlande : 1,9 points de pourcentage de plus en Pologne. En 2015, elles représentaient 2,1 % en Pologne et 1,5 % en Finlande, soit 0,6 points de pourcentage de plus en Pologne.
Les dépenses militaires de la Pologne, en part du PIB, sont supérieures à celles de la Finlande chaque année depuis 1980.
Pologne vs Finlande : chiffres des dépenses militaires
|
Pologne
|
Finlande
|
|
|---|---|---|
| $ US, 2025 | 46,6 Md $US | 8,15 Md $US |
| % du PIB, 2025 | 4,5 % | 2,6 % |
| Par personne, $ US | 1 278 $US | 1 444 $US |
| Part mondiale | 1,63 % | 0,29 % |
| Rang mondial | 14/154 | 35/154 |
Comparer les dépenses militaires de 2 pays au choix
Sources :
- Banque mondiale | Secteur public (1960–2025, mis à jour en octobre 2026)
Creative Commons Attribution (CC BY) : vous pouvez copier, partager, adapter et réutiliser ce contenu, y compris à des fins commerciales, à condition de citer statistics.wiki et d’indiquer les modifications apportées. Les sources citées ci-dessus peuvent avoir leurs propres conditions de licence.