
Maroc vs Grèce : dépenses militaires ($ US), 1960–2025
| Année | $ US | |
|---|---|---|
 Maroc |
 Grèce |
|
| 2025 | 6 461 712 109 $ US | 8 387 674 459 $ US |
| 2024 | 5 517 154 045 $ US | 7 391 576 234 $ US |
| 2023 | 5 188 378 244 $ US | 7 020 677 204 $ US |
| 2022 | 4 993 737 612 $ US | 8 755 994 134 $ US |
| 2021 | 5 325 480 915 $ US | 8 300 944 606 $ US |
| 2020 | 4 829 508 152 $ US | 5 785 109 070 $ US |
| 2019 | 3 694 594 906 $ US | 5 382 657 349 $ US |
| 2018 | 3 696 571 804 $ US | 5 760 223 706 $ US |
| 2017 | 3 492 074 802 $ US | 5 122 991 175 $ US |
| 2016 | 3 327 237 304 $ US | 4 968 002 555 $ US |
| 2015 | 3 268 246 892 $ US | 4 820 278 740 $ US |
| 2014 | 4 048 612 374 $ US | 5 538 652 606 $ US |
| 2013 | 4 404 786 006 $ US | 5 656 789 421 $ US |
| 2012 | 3 702 974 637 $ US | 5 914 653 128 $ US |
| 2011 | 3 629 903 573 $ US | 7 137 946 546 $ US |
| 2010 | 3 420 137 659 $ US | 8 171 584 944 $ US |
| 2009 | 3 326 634 205 $ US | 10 684 172 838 $ US |
| 2008 | 3 241 533 696 $ US | 10 616 942 481 $ US |
| 2007 | 2 649 262 630 $ US | 8 544 382 378 $ US |
| 2006 | 2 359 832 518 $ US | 7 613 951 281 $ US |
| 2005 | 2 243 217 384 $ US | 7 031 224 991 $ US |
| 2004 | 2 148 357 719 $ US | 6 278 721 330 $ US |
| 2003 | 2 027 666 391 $ US | 5 046 898 334 $ US |
| 2002 | 1 643 835 744 $ US | 4 756 519 516 $ US |
| 2001 | 1 633 220 512 $ US | 4 431 977 945 $ US |
| 2000 | 951 099 681 $ US | 4 520 824 828 $ US |
| 1999 | 1 341 937 884 $ US | 4 791 656 313 $ US |
| 1998 | 1 607 112 827 $ US | 4 824 201 559 $ US |
| 1997 | 1 641 335 786 $ US | 4 573 767 631 $ US |
| 1996 | 1 704 490 568 $ US | 4 613 278 590 $ US |
| 1995 | 1 696 806 726 $ US | 4 179 673 498 $ US |
| 1994 | 1 599 985 631 $ US | 4 118 554 048 $ US |
| 1993 | 1 473 743 269 $ US | 3 862 779 156 $ US |
| 1992 | 1 448 918 039 $ US | 4 160 048 680 $ US |
| 1991 | 1 337 540 605 $ US | 3 613 138 245 $ US |
| 1990 | 1 252 113 521 $ US | 3 666 445 017 $ US |
| 1989 | 1 155 966 046 $ US | 2 939 936 461 $ US |
| 1988 | 1 061 247 219 $ US | 3 157 096 252 $ US |
| 1987 | 950 989 927 $ US | 2 755 008 197 $ US |
| 1986 | 837 737 601 $ US | 2 294 988 396 $ US |
| 1985 | 808 095 411 $ US | 2 212 814 732 $ US |
| 1984 | 595 683 456 $ US | 2 289 686 677 $ US |
| 1983 | 732 232 960 $ US | 2 521 137 388 $ US |
| 1982 | 1 100 613 230 $ US | 3 030 390 226 $ US |
| 1981 | 1 135 703 418 $ US | 2 960 680 476 $ US |
| 1980 | 1 290 689 696 $ US | 2 611 881 031 $ US |
| 1979 | 896 396 226 $ US | 2 783 580 144 $ US |
| 1978 | 772 615 230 $ US | 2 433 931 339 $ US |
| 1977 | 731 470 821 $ US | 2 111 323 987 $ US |
| 1976 | 596 184 891 $ US | 1 790 712 551 $ US |
| 1975 | 413 564 957 $ US | 1 644 800 618 $ US |
| 1974 | 241 457 382 $ US | 1 206 055 258 $ US |
| 1973 | 191 121 882 $ US | 775 198 235 $ US |
| 1972 | 144 303 607 $ US | 658 787 514 $ US |
| 1971 | 114 520 486 $ US | 592 703 611 $ US |
| 1970 | 91 628 992 $ US | 543 849 215 $ US |
| 1969 | 87 281 698 $ US | 548 512 647 $ US |
| 1968 | 98 292 245 $ US | 466 688 471 $ US |
| 1967 | 79 742 569 $ US | 397 484 187 $ US |
| 1966 | 77 017 661 $ US | 303 695 485 $ US |
| 1965 | 71 624 730 $ US | 265 260 946 $ US |
| 1964 | 79 357 398 $ US | 235 029 833 $ US |
| 1963 | 84 915 576 $ US | 222 328 216 $ US |
| 1962 | 61 058 760 $ US | 208 111 267 $ US |
| 1961 | 54 743 023 $ US | 207 612 310 $ US |
| 1960 | 47 175 036 $ US | 207 644 373 $ US |
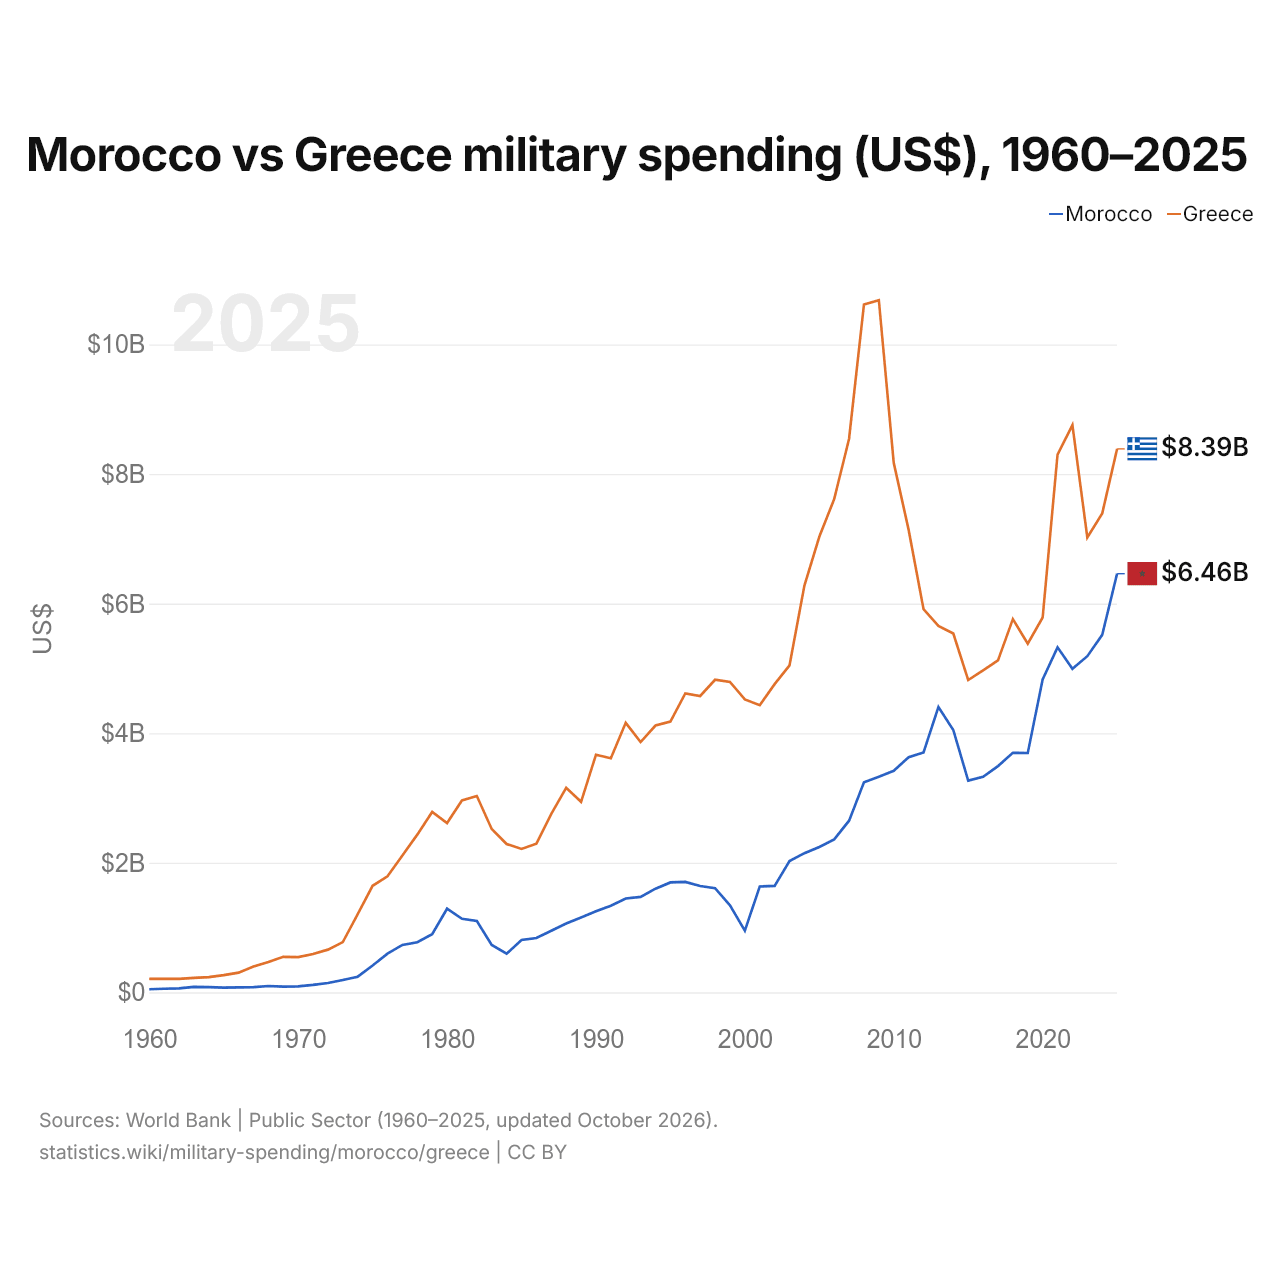
En 2025, les dépenses militaires s'élevaient à 6,46 milliards de dollars au Maroc et à 8,39 milliards de dollars en Grèce : 30 % de plus en Grèce. En 1960, elles s'élevaient à 47,2 millions de dollars au Maroc et à 208 millions de dollars en Grèce, soit 4,4 fois plus en Grèce.
Maroc vs Grèce : dépenses militaires en % du PIB, 1960–2025
| Année | % du PIB | |
|---|---|---|
|
Maroc
|
Grèce
|
|
| 2025 | 3,5 % | 3 % |
| 2024 | 3,4 % | 2,9 % |
| 2023 | 3,6 % | 2,9 % |
| 2022 | 3,8 % | 4 % |
| 2021 | 3,7 % | 3,8 % |
| 2020 | 4 % | 3 % |
| 2019 | 2,9 % | 2,6 % |
| 2018 | 2,9 % | 2,7 % |
| 2017 | 2,9 % | 2,6 % |
| 2016 | 3 % | 2,6 % |
| 2015 | 3 % | 2,5 % |
| 2014 | 3,4 % | 2,4 % |
| 2013 | 3,8 % | 2,4 % |
| 2012 | 3,5 % | 2,5 % |
| 2011 | 3,3 % | 2,5 % |
| 2010 | 3,4 % | 2,8 % |
| 2009 | 3,3 % | 3,3 % |
| 2008 | 3,2 % | 3 % |
| 2007 | 3 % | 2,7 % |
| 2006 | 3,1 % | 2,8 % |
| 2005 | 3,3 % | 2,9 % |
| 2004 | 3,2 % | 2,7 % |
| 2003 | 3,5 % | 2,6 % |
| 2002 | 3,5 % | 3,2 % |
| 2001 | 3,7 % | 3,4 % |
| 2000 | 2,2 % | 3,6 % |
| 1999 | 2,9 % | 3,5 % |
| 1998 | 3,5 % | 3,5 % |
| 1997 | 4,2 % | 3,3 % |
| 1996 | 3,9 % | 3,2 % |
| 1995 | 4,3 % | 3,1 % |
| 1994 | 4,5 % | 3,6 % |
| 1993 | 4,7 % | 3,6 % |
| 1992 | 4,3 % | 3,6 % |
| 1991 | 4,1 % | 3,5 % |
| 1990 | 4,1 % | 3,8 % |
| 1989 | 4,4 % | 3,8 % |
| 1988 | 4,1 % | 4,2 % |
| 1987 | 4,4 % | 4,3 % |
| 1986 | 4,3 % | 4,1 % |
| 1985 | 5,4 % | 4,7 % |
| 1984 | 4 % | 4,8 % |
| 1983 | 4,5 % | 5,2 % |
| 1982 | 6,2 % | 5,6 % |
| 1981 | 6,4 % | 5,7 % |
| 1980 | 5,9 % | 4,7 % |
| 1979 | 5,6 % | 5,2 % |
| 1978 | 5,8 % | 5,6 % |
| 1977 | 6,6 % | 5,9 % |
| 1976 | 6,2 % | 5,8 % |
| 1975 | 4,6 % | 5,8 % |
| 1974 | 3,1 % | 4,8 % |
| 1973 | 3,1 % | 3,5 % |
| 1972 | 2,8 % | 4 % |
| 1971 | 2,6 % | 4,1 % |
| 1970 | 2,3 % | 4,2 % |
| 1969 | 2,4 % | 4,8 % |
| 1968 | 3 % | 4,7 % |
| 1967 | 2,6 % | 4,3 % |
| 1966 | 2,7 % | 3,6 % |
| 1965 | 2,4 % | 3,5 % |
| 1964 | 2,8 % | 3,6 % |
| 1963 | 3,2 % | 3,8 % |
| 1962 | 2,6 % | 4 % |
| 1961 | 2,7 % | 4,2 % |
| 1960 | 2,3 % | 4,9 % |
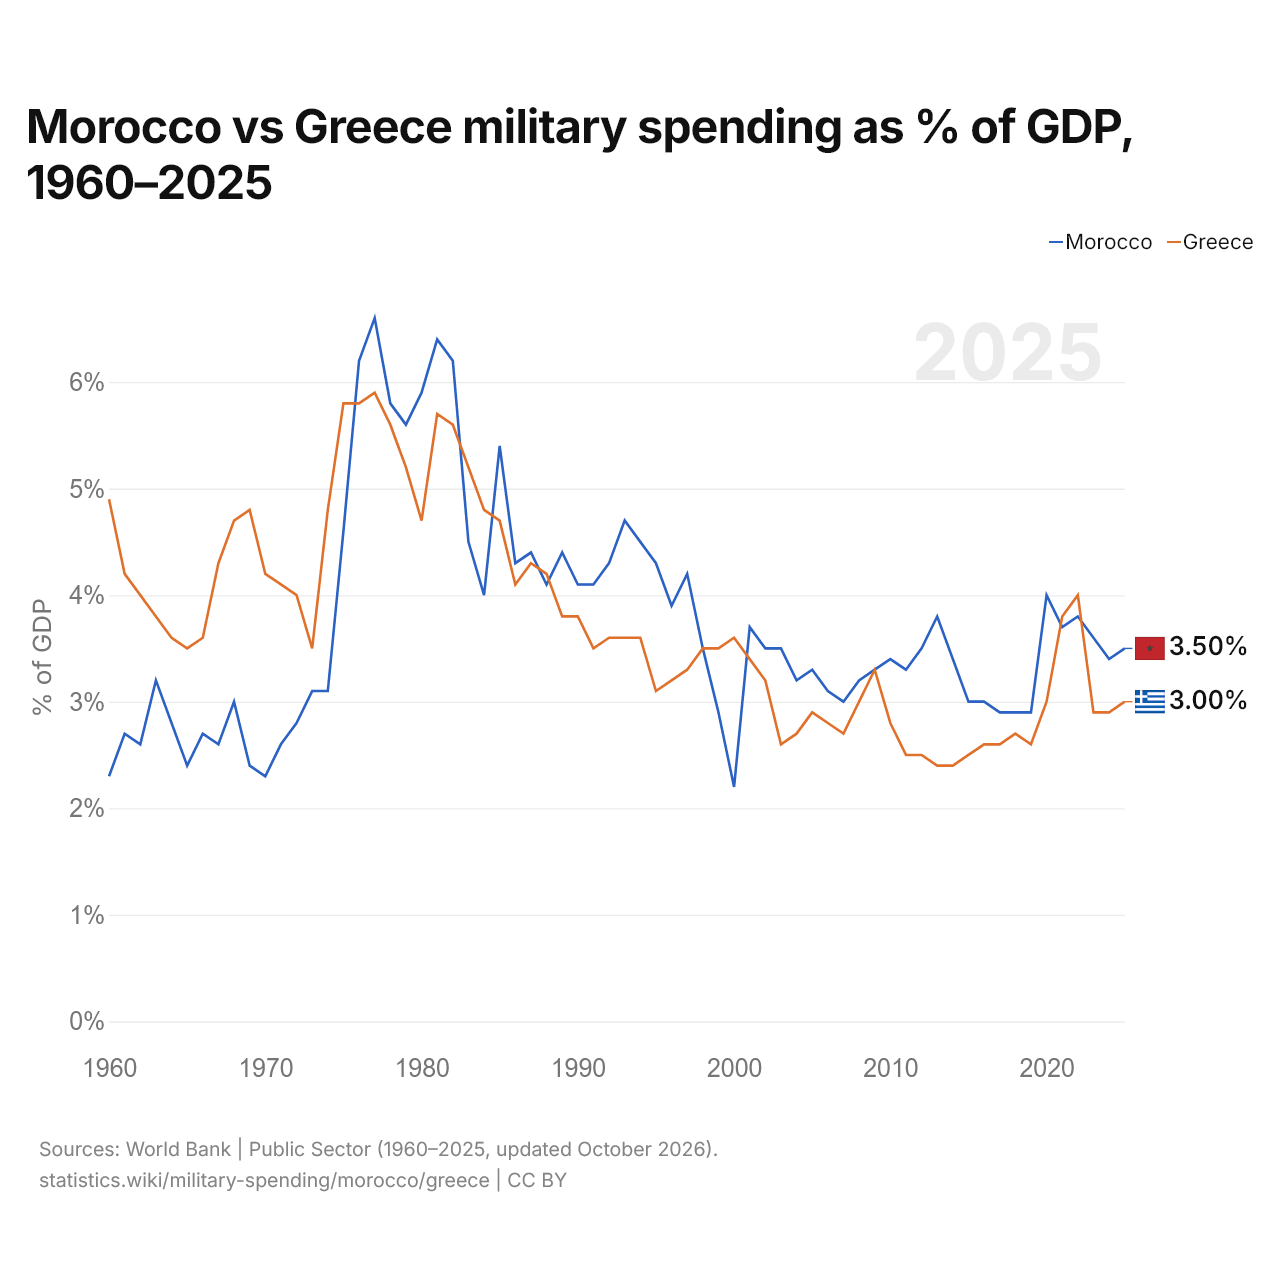
En 2025, les dépenses militaires représentaient 3,5 % du PIB au Maroc et 3,0 % en Grèce : 0,5 points de pourcentage de plus au Maroc. En 2015, elles représentaient 3,0 % au Maroc et 2,5 % en Grèce, soit 0,5 points de pourcentage de plus au Maroc.
Les dépenses militaires du Maroc, en part du PIB, sont supérieures à celles de la Grèce chaque année depuis 2023.
Maroc vs Grèce : chiffres des dépenses militaires
|
Maroc
|
Grèce
|
|
|---|---|---|
| $ US, 2025 | 6,46 Md $US | 8,39 Md $US |
| % du PIB, 2025 | 3,5 % | 3,0 % |
| Par personne, $ US | 168,1 $US | 805 $US |
| Part mondiale | 0,23 % | 0,29 % |
| Rang mondial | 40/154 | 34/154 |
Comparer les dépenses militaires de 2 pays au choix
Sources :
- Banque mondiale | Secteur public (1960–2025, mis à jour en octobre 2026)
Creative Commons Attribution (CC BY) : vous pouvez copier, partager, adapter et réutiliser ce contenu, y compris à des fins commerciales, à condition de citer statistics.wiki et d’indiquer les modifications apportées. Les sources citées ci-dessus peuvent avoir leurs propres conditions de licence.