
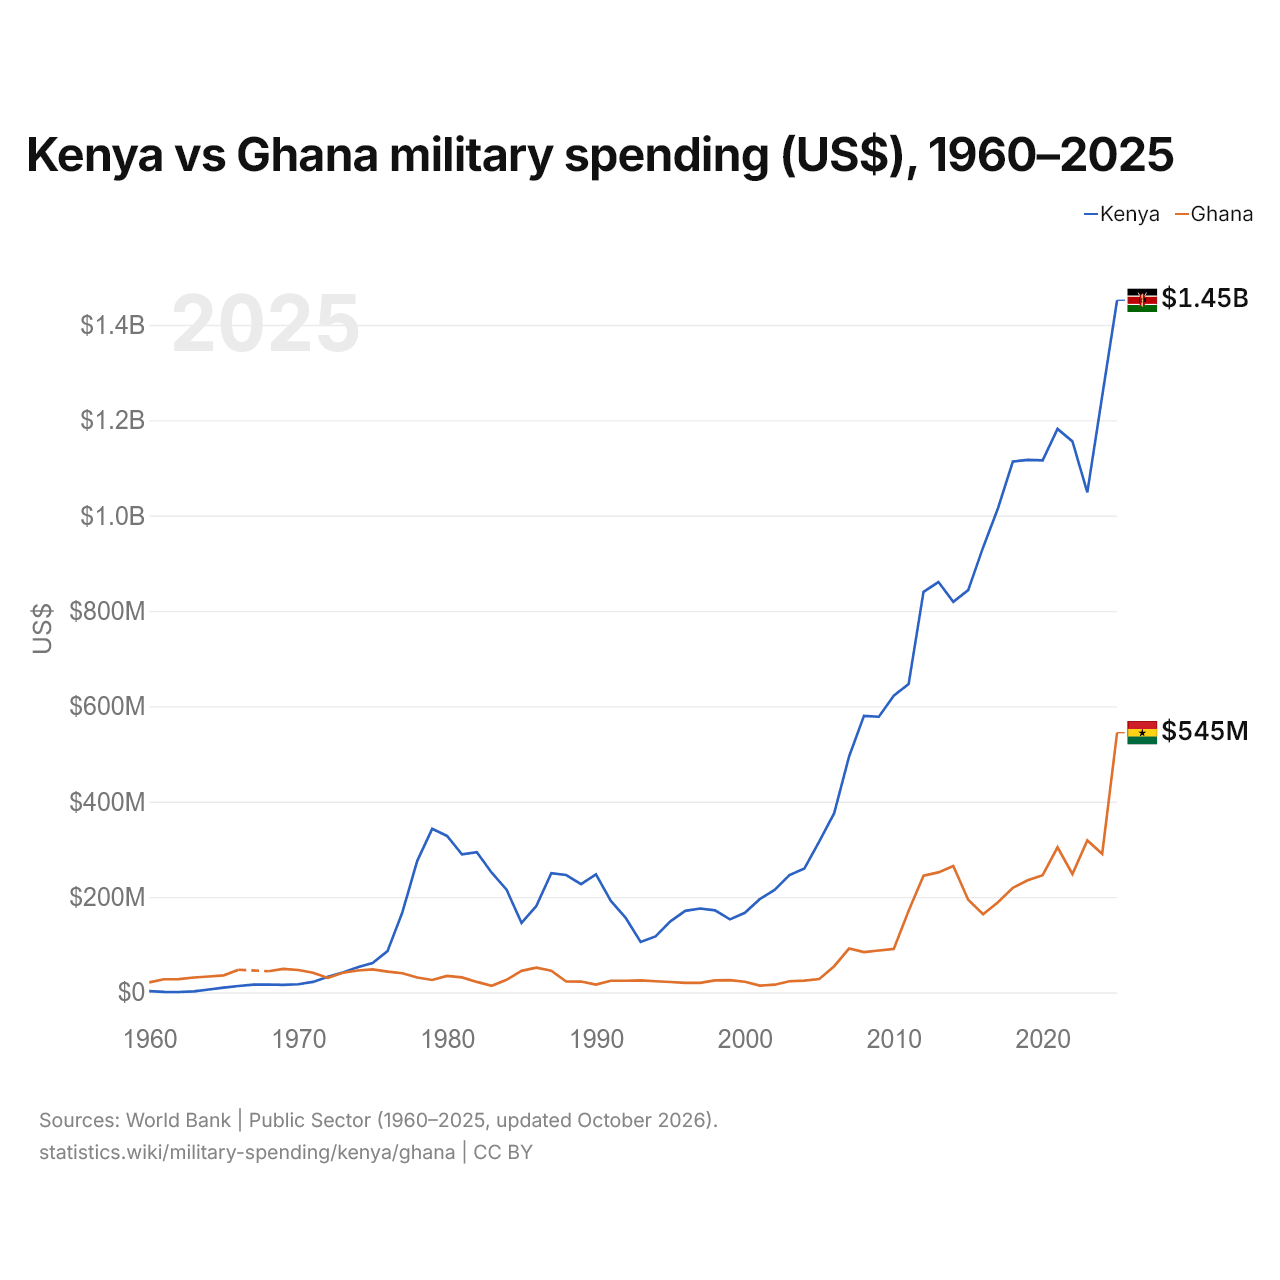
Kenya vs Ghana : dépenses militaires ($ US), 1960–2025
| Année | $ US | |
|---|---|---|
 Kenya |
 Ghana |
|
| 2025 | 1 451 579 908 $ US | 544 571 308 $ US |
| 2024 | 1 250 779 200 $ US | 290 634 699 $ US |
| 2023 | 1 048 550 867 $ US | 318 495 228 $ US |
| 2022 | 1 155 600 535 $ US | 248 133 724 $ US |
| 2021 | 1 181 728 090 $ US | 304 334 183 $ US |
| 2020 | 1 115 722 215 $ US | 245 693 395 $ US |
| 2019 | 1 116 781 551 $ US | 235 008 765 $ US |
| 2018 | 1 113 245 289 $ US | 219 182 253 $ US |
| 2017 | 1 015 278 937 $ US | 188 825 947 $ US |
| 2016 | 933 176 626 $ US | 163 611 131 $ US |
| 2015 | 843 667 766 $ US | 194 244 690 $ US |
| 2014 | 819 042 628 $ US | 265 184 902 $ US |
| 2013 | 860 561 126 $ US | 251 568 018 $ US |
| 2012 | 840 072 505 $ US | 244 827 260 $ US |
| 2011 | 646 678 296 $ US | 171 175 290 $ US |
| 2010 | 622 050 232 $ US | 91 018 798 $ US |
| 2009 | 578 071 588 $ US | 87 721 115 $ US |
| 2008 | 580 011 941 $ US | 84 326 994 $ US |
| 2007 | 494 684 828 $ US | 91 943 809 $ US |
| 2006 | 375 807 021 $ US | 54 763 395 $ US |
| 2005 | 316 780 428 $ US | 28 039 786 $ US |
| 2004 | 259 810 004 $ US | 24 652 233 $ US |
| 2003 | 245 939 422 $ US | 23 185 032 $ US |
| 2002 | 214 624 684 $ US | 16 050 959 $ US |
| 2001 | 195 407 583 $ US | 14 055 331 $ US |
| 2000 | 166 915 525 $ US | 22 105 440 $ US |
| 1999 | 153 072 310 $ US | 25 753 102 $ US |
| 1998 | 171 964 054 $ US | 25 043 059 $ US |
| 1997 | 175 834 999 $ US | 19 843 096 $ US |
| 1996 | 170 804 915 $ US | 19 891 005 $ US |
| 1995 | 148 967 224 $ US | 21 704 018 $ US |
| 1994 | 117 319 189 $ US | 23 233 548 $ US |
| 1993 | 105 702 976 $ US | 25 185 968 $ US |
| 1992 | 156 034 597 $ US | 24 210 990 $ US |
| 1991 | 191 907 084 $ US | 24 364 106 $ US |
| 1990 | 247 588 156 $ US | 16 283 994 $ US |
| 1989 | 227 027 884 $ US | 22 627 449 $ US |
| 1988 | 246 112 205 $ US | 22 760 000 $ US |
| 1987 | 249 785 065 $ US | 45 299 320 $ US |
| 1986 | 181 236 986 $ US | 51 650 741 $ US |
| 1985 | 145 753 533 $ US | 45 063 025 $ US |
| 1984 | 215 270 848 $ US | 26 174 168 $ US |
| 1983 | 250 841 356 $ US | 13 842 593 $ US |
| 1982 | 294 102 179 $ US | 21 848 739 $ US |
| 1981 | 289 624 541 $ US | 31 293 088 $ US |
| 1980 | 328 052 246 $ US | 34 387 164 $ US |
| 1979 | 342 991 626 $ US | 25 982 906 $ US |
| 1978 | 275 756 684 $ US | 31 178 010 $ US |
| 1977 | 168 097 655 $ US | 39 971 429 $ US |
| 1976 | 86 333 448 $ US | 43 326 271 $ US |
| 1975 | 61 239 918 $ US | 48 191 489 $ US |
| 1974 | 52 776 244 $ US | 45 776 398 $ US |
| 1973 | 41 631 308 $ US | 41 040 392 $ US |
| 1972 | 32 490 280 $ US | 30 202 417 $ US |
| 1971 | 21 833 578 $ US | 41 122 739 $ US |
| 1970 | 16 956 187 $ US | 46 918 600 $ US |
| 1969 | 15 751 506 $ US | 49 075 802 $ US |
| 1968 | 16 487 779 $ US | 44 271 156 $ US |
| 1967 | 16 084 824 $ US | - |
| 1966 | 13 197 134 $ US | 47 344 508 $ US |
| 1965 | 9 882 742 $ US | 35 578 417 $ US |
| 1964 | 5 891 558 $ US | 33 275 317 $ US |
| 1963 | 1 913 311 $ US | 31 067 853 $ US |
| 1962 | 671 220 $ US | 27 664 180 $ US |
| 1961 | 895 999 $ US | 27 395 297 $ US |
| 1960 | 2 589 952 $ US | 20 773 967 $ US |
En 2025, les dépenses militaires s'élevaient à 1,45 milliard de dollars au Kenya et à 545 millions de dollars au Ghana : 2,7 fois plus au Kenya. En 1960, elles s'élevaient à 2,59 millions de dollars au Kenya et à 20,8 millions de dollars au Ghana, soit 8,0 fois plus au Ghana.
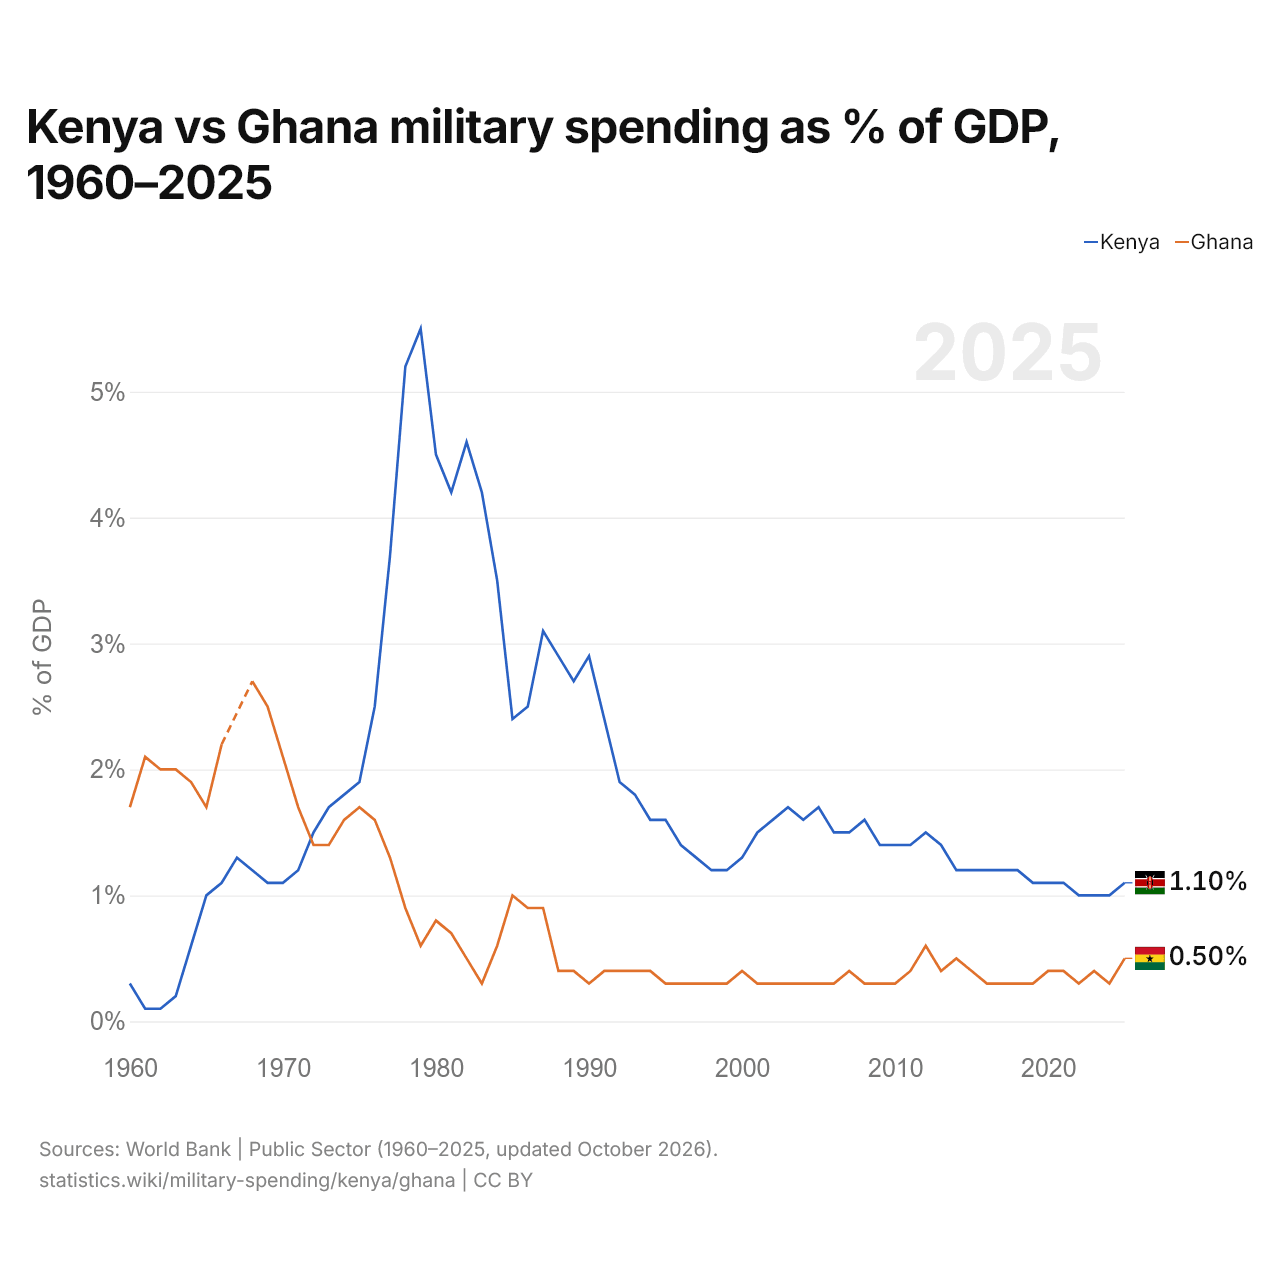
Kenya vs Ghana : dépenses militaires en % du PIB, 1960–2025
| Année | % du PIB | |
|---|---|---|
|
Kenya
|
Ghana
|
|
| 2025 | 1,1 % | 0,5 % |
| 2024 | 1 % | 0,3 % |
| 2023 | 1 % | 0,4 % |
| 2022 | 1 % | 0,3 % |
| 2021 | 1,1 % | 0,4 % |
| 2020 | 1,1 % | 0,4 % |
| 2019 | 1,1 % | 0,3 % |
| 2018 | 1,2 % | 0,3 % |
| 2017 | 1,2 % | 0,3 % |
| 2016 | 1,2 % | 0,3 % |
| 2015 | 1,2 % | 0,4 % |
| 2014 | 1,2 % | 0,5 % |
| 2013 | 1,4 % | 0,4 % |
| 2012 | 1,5 % | 0,6 % |
| 2011 | 1,4 % | 0,4 % |
| 2010 | 1,4 % | 0,3 % |
| 2009 | 1,4 % | 0,3 % |
| 2008 | 1,6 % | 0,3 % |
| 2007 | 1,5 % | 0,4 % |
| 2006 | 1,5 % | 0,3 % |
| 2005 | 1,7 % | 0,3 % |
| 2004 | 1,6 % | 0,3 % |
| 2003 | 1,7 % | 0,3 % |
| 2002 | 1,6 % | 0,3 % |
| 2001 | 1,5 % | 0,3 % |
| 2000 | 1,3 % | 0,4 % |
| 1999 | 1,2 % | 0,3 % |
| 1998 | 1,2 % | 0,3 % |
| 1997 | 1,3 % | 0,3 % |
| 1996 | 1,4 % | 0,3 % |
| 1995 | 1,6 % | 0,3 % |
| 1994 | 1,6 % | 0,4 % |
| 1993 | 1,8 % | 0,4 % |
| 1992 | 1,9 % | 0,4 % |
| 1991 | 2,4 % | 0,4 % |
| 1990 | 2,9 % | 0,3 % |
| 1989 | 2,7 % | 0,4 % |
| 1988 | 2,9 % | 0,4 % |
| 1987 | 3,1 % | 0,9 % |
| 1986 | 2,5 % | 0,9 % |
| 1985 | 2,4 % | 1 % |
| 1984 | 3,5 % | 0,6 % |
| 1983 | 4,2 % | 0,3 % |
| 1982 | 4,6 % | 0,5 % |
| 1981 | 4,2 % | 0,7 % |
| 1980 | 4,5 % | 0,8 % |
| 1979 | 5,5 % | 0,6 % |
| 1978 | 5,2 % | 0,9 % |
| 1977 | 3,7 % | 1,3 % |
| 1976 | 2,5 % | 1,6 % |
| 1975 | 1,9 % | 1,7 % |
| 1974 | 1,8 % | 1,6 % |
| 1973 | 1,7 % | 1,4 % |
| 1972 | 1,5 % | 1,4 % |
| 1971 | 1,2 % | 1,7 % |
| 1970 | 1,1 % | 2,1 % |
| 1969 | 1,1 % | 2,5 % |
| 1968 | 1,2 % | 2,7 % |
| 1967 | 1,3 % | - |
| 1966 | 1,1 % | 2,2 % |
| 1965 | 1 % | 1,7 % |
| 1964 | 0,6 % | 1,9 % |
| 1963 | 0,2 % | 2 % |
| 1962 | 0,1 % | 2 % |
| 1961 | 0,1 % | 2,1 % |
| 1960 | 0,3 % | 1,7 % |
En 2025, les dépenses militaires représentaient 1,1 % du PIB au Kenya et 0,5 % au Ghana : 0,6 points de pourcentage de plus au Kenya. En 2015, elles représentaient 1,2 % au Kenya et 0,4 % au Ghana, soit 0,8 points de pourcentage de plus au Kenya.
Les dépenses militaires du Kenya, en part du PIB, sont supérieures à celles du Ghana chaque année depuis 1972. L'écart a été le plus grand en 1979, quand les dépenses militaires du Kenya dépassaient celles du Ghana de 4,9 points de pourcentage du PIB.
Kenya vs Ghana : chiffres des dépenses militaires
|
Kenya
|
Ghana
|
|
|---|---|---|
| $ US, 2025 | 1,45 Md $US | 545 M $US |
| % du PIB, 2025 | 1,1 % | 0,5 % |
| Par personne, $ US | 25,2 $US | 15,5 $US |
| Part mondiale | 0,05 % | 0,02 % |
| Rang mondial | 75/154 | 104/154 |
Comparer les dépenses militaires de 2 pays au choix
Sources :
- Banque mondiale | Secteur public (1960–2025, mis à jour en octobre 2026)
Creative Commons Attribution (CC BY) : vous pouvez copier, partager, adapter et réutiliser ce contenu, y compris à des fins commerciales, à condition de citer statistics.wiki et d’indiquer les modifications apportées. Les sources citées ci-dessus peuvent avoir leurs propres conditions de licence.