
Japon vs Iran : dépenses militaires ($ US), 1960–2025
| Année | $ US | |
|---|---|---|
 Japon |
 Iran |
|
| 2025 | 62 609 864 919 $ US | 7 585 783 794 $ US |
| 2024 | 54 245 069 556 $ US | 10 544 798 901 $ US |
| 2023 | 48 096 470 836 $ US | 11 409 446 462 $ US |
| 2022 | 43 144 132 918 $ US | 9 459 492 512 $ US |
| 2021 | 53 616 495 860 $ US | 9 440 843 617 $ US |
| 2020 | 51 388 082 015 $ US | 6 115 969 218 $ US |
| 2019 | 50 782 354 519 $ US | 7 471 128 101 $ US |
| 2018 | 48 518 354 328 $ US | 9 705 656 467 $ US |
| 2017 | 45 029 861 071 $ US | 14 512 949 474 $ US |
| 2016 | 46 510 024 990 $ US | 13 384 245 776 $ US |
| 2015 | 42 106 110 979 $ US | 10 463 402 998 $ US |
| 2014 | 46 903 457 732 $ US | 9 784 521 436 $ US |
| 2013 | 49 023 953 366 $ US | 10 912 579 140 $ US |
| 2012 | 60 011 575 603 $ US | 17 302 277 456 $ US |
| 2011 | 60 762 198 739 $ US | 14 982 440 345 $ US |
| 2010 | 54 655 477 013 $ US | 13 572 427 670 $ US |
| 2009 | 51 465 158 207 $ US | 12 619 302 014 $ US |
| 2008 | 46 361 235 314 $ US | 10 896 272 017 $ US |
| 2007 | 40 530 225 228 $ US | 9 281 949 067 $ US |
| 2006 | 41 552 485 700 $ US | 8 805 227 250 $ US |
| 2005 | 44 300 524 700 $ US | 6 831 572 900 $ US |
| 2004 | 45 339 809 417 $ US | 5 322 011 853 $ US |
| 2003 | 42 485 994 124 $ US | 3 653 526 060 $ US |
| 2002 | 39 333 708 170 $ US | 2 797 090 548 $ US |
| 2001 | 40 758 000 772 $ US | 3 068 155 672 $ US |
| 2000 | 45 509 462 675 $ US | 2 515 175 965 $ US |
| 1999 | 43 122 982 293 $ US | 2 737 544 885 $ US |
| 1998 | 37 848 918 937 $ US | 2 899 267 444 $ US |
| 1997 | 40 634 866 858 $ US | 2 846 697 182 $ US |
| 1996 | 44 047 064 188 $ US | 2 702 905 136 $ US |
| 1995 | 49 961 673 238 $ US | 2 077 030 068 $ US |
| 1994 | 45 285 691 376 $ US | 1 489 280 678 $ US |
| 1993 | 44 039 316 448 $ US | 1 083 871 838 $ US |
| 1992 | 38 544 439 528 $ US | 2 143 027 713 $ US |
| 1991 | 35 044 558 915 $ US | 2 856 152 904 $ US |
| 1990 | 30 636 431 903 $ US | 3 672 817 667 $ US |
| 1989 | 29 869 183 898 $ US | 5 492 200 716 $ US |
| 1988 | 30 310 401 999 $ US | 7 715 454 251 $ US |
| 1987 | 25 442 124 704 $ US | 7 891 993 107 $ US |
| 1986 | 20 842 255 076 $ US | 12 711 560 920 $ US |
| 1985 | 13 979 102 078 $ US | 11 734 311 920 $ US |
| 1984 | 13 170 056 544 $ US | 10 312 448 927 $ US |
| 1983 | 12 357 220 999 $ US | 11 097 361 274 $ US |
| 1982 | 10 960 248 415 $ US | 9 958 630 432 $ US |
| 1981 | 11 654 664 249 $ US | 8 231 276 439 $ US |
| 1980 | 10 456 787 749 $ US | 5 041 918 103 $ US |
| 1979 | 9 986 839 054 $ US | 5 240 240 422 $ US |
| 1978 | 9 424 638 219 $ US | 8 667 668 366 $ US |
| 1977 | 6 703 182 674 $ US | 8 213 015 603 $ US |
| 1976 | 5 452 405 066 $ US | 7 654 840 763 $ US |
| 1975 | 4 936 934 814 $ US | 6 248 972 157 $ US |
| 1974 | 4 313 402 711 $ US | 4 043 457 403 $ US |
| 1973 | 3 673 734 622 $ US | 504 993 895 $ US |
| 1972 | 2 795 134 058 $ US | 390 304 805 $ US |
| 1971 | 2 064 674 316 $ US | 418 409 746 $ US |
| 1970 | 1 715 009 394 $ US | 642 868 064 $ US |
| 1969 | 1 453 785 367 $ US | 581 570 299 $ US |
| 1968 | 1 271 785 959 $ US | 446 366 785 $ US |
| 1967 | 1 131 129 601 $ US | 336 818 382 $ US |
| 1966 | 1 015 092 385 $ US | 259 307 443 $ US |
| 1965 | 894 206 643 $ US | 201 383 454 $ US |
| 1964 | 781 704 862 $ US | 155 037 831 $ US |
| 1963 | 685 721 485 $ US | 127 669 059 $ US |
| 1962 | 585 914 688 $ US | 108 299 862 $ US |
| 1961 | 535 995 933 $ US | 103 884 655 $ US |
| 1960 | 523 200 321 $ US | 96 366 306 $ US |
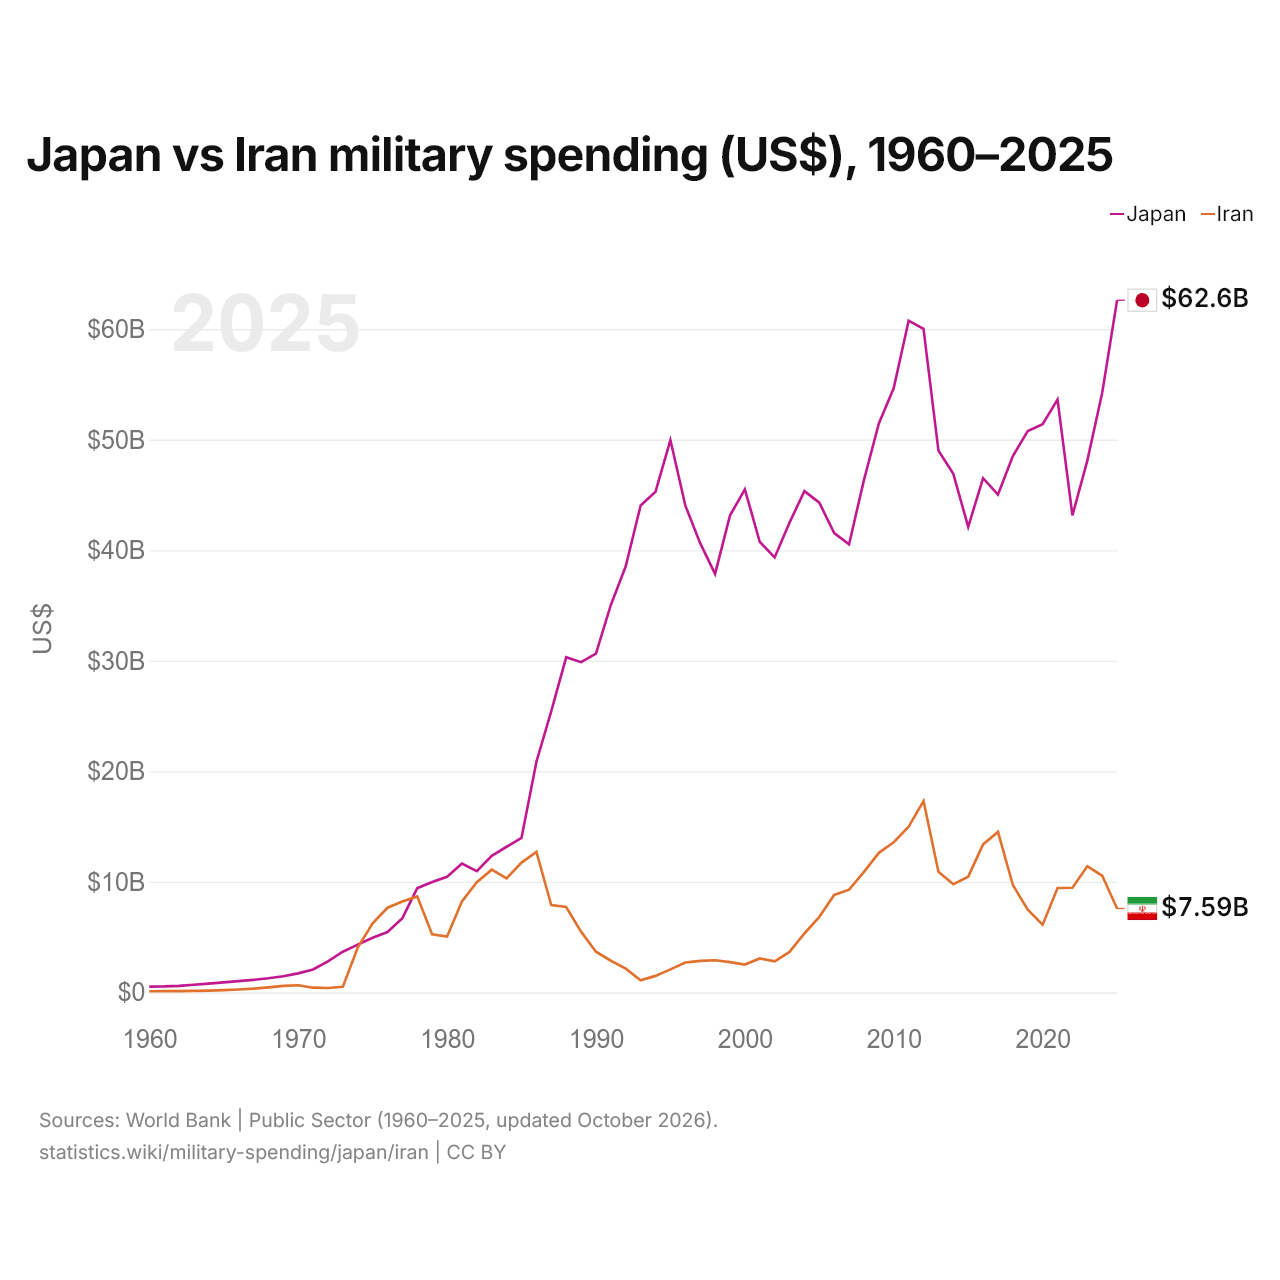
En 2025, les dépenses militaires s'élevaient à 62,6 milliards de dollars au Japon et à 7,59 milliards de dollars en Iran : 8,3 fois plus au Japon. En 1960, elles s'élevaient à 523 millions de dollars au Japon et à 96,4 millions de dollars en Iran, soit 5,4 fois plus au Japon.
Japon vs Iran : dépenses militaires en % du PIB, 1960–2025
| Année | % du PIB | |
|---|---|---|
|
Japon
|
Iran
|
|
| 2025 | 1,4 % | 2,1 % |
| 2024 | 1,3 % | 2,2 % |
| 2023 | 1,1 % | 2,5 % |
| 2022 | 1 % | 2,2 % |
| 2021 | 1 % | 2,3 % |
| 2020 | 1 % | 2,2 % |
| 2019 | 1 % | 2,1 % |
| 2018 | 0,9 % | 2,4 % |
| 2017 | 0,9 % | 2,8 % |
| 2016 | 0,9 % | 2,8 % |
| 2015 | 0,9 % | 2,6 % |
| 2014 | 0,9 % | 2,1 % |
| 2013 | 0,9 % | 2,2 % |
| 2012 | 0,9 % | 2,7 % |
| 2011 | 1 % | 2,4 % |
| 2010 | 0,9 % | 2,8 % |
| 2009 | 1 % | 3 % |
| 2008 | 0,9 % | 2,7 % |
| 2007 | 0,9 % | 2,7 % |
| 2006 | 0,9 % | 3,3 % |
| 2005 | 0,9 % | 3 % |
| 2004 | 0,9 % | 2,8 % |
| 2003 | 0,9 % | 2,4 % |
| 2002 | 0,9 % | 2,2 % |
| 2001 | 0,9 % | 2,4 % |
| 2000 | 0,9 % | 2,3 % |
| 1999 | 0,9 % | 2,4 % |
| 1998 | 0,9 % | 2,6 % |
| 1997 | 0,9 % | 2,5 % |
| 1996 | 0,9 % | 2,2 % |
| 1995 | 0,9 % | 2,2 % |
| 1994 | 0,9 % | 2,1 % |
| 1993 | 1 % | 1,7 % |
| 1992 | 0,9 % | 1,8 % |
| 1991 | 0,9 % | 2,2 % |
| 1990 | 0,9 % | 2,9 % |
| 1989 | 0,9 % | 4,6 % |
| 1988 | 0,9 % | 6,3 % |
| 1987 | 1 % | 5,9 % |
| 1986 | 1 % | 6,1 % |
| 1985 | 1 % | 6,5 % |
| 1984 | 1 % | 6,4 % |
| 1983 | 1 % | 7,1 % |
| 1982 | 0,9 % | 7,9 % |
| 1981 | 0,9 % | 8,2 % |
| 1980 | 0,9 % | 5,3 % |
| 1979 | 0,9 % | 5,8 % |
| 1978 | 0,9 % | 11,1 % |
| 1977 | 0,9 % | 10,2 % |
| 1976 | 0,9 % | 11,2 % |
| 1975 | 0,9 % | 12,1 % |
| 1974 | 0,9 % | 8,8 % |
| 1973 | 0,8 % | 1,9 % |
| 1972 | 0,8 % | 2,3 % |
| 1971 | 0,8 % | 3 % |
| 1970 | 0,8 % | 5,9 % |
| 1969 | 0,8 % | 6 % |
| 1968 | 0,8 % | 5,2 % |
| 1967 | 0,8 % | 4,5 % |
| 1966 | 0,9 % | 3,8 % |
| 1965 | 0,9 % | 3,2 % |
| 1964 | 0,9 % | 2,9 % |
| 1963 | 0,9 % | 2,6 % |
| 1962 | 0,9 % | 2,3 % |
| 1961 | 0,9 % | 2,3 % |
| 1960 | 1,1 % | 2,3 % |
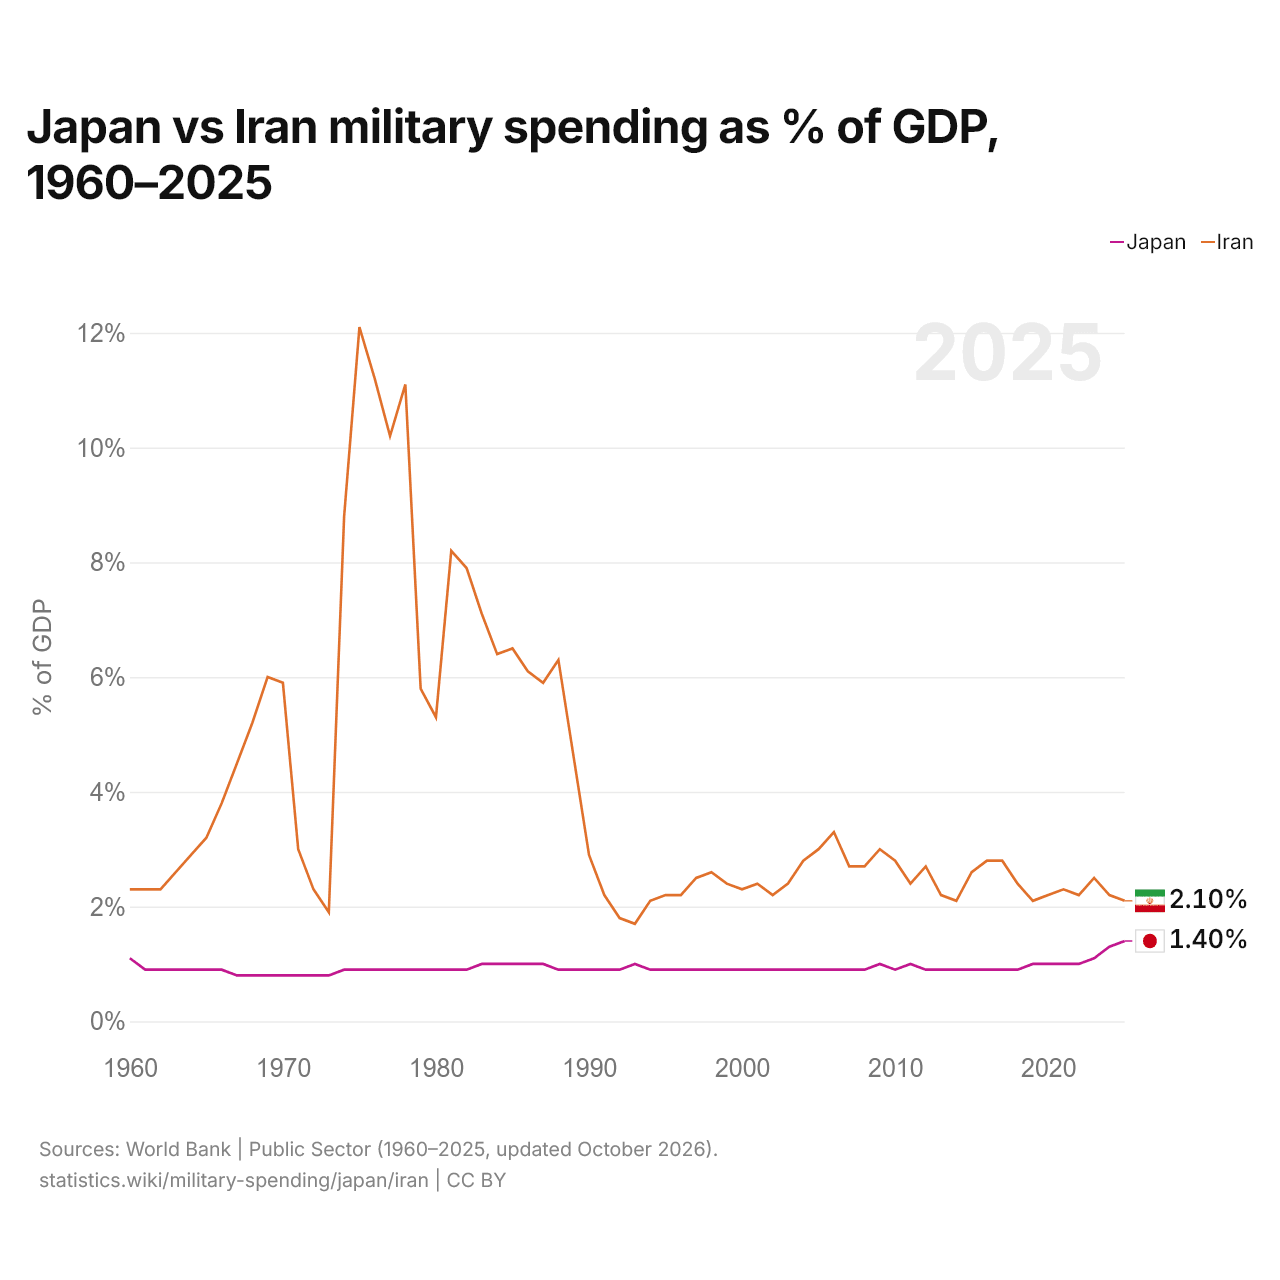
En 2025, les dépenses militaires représentaient 1,4 % du PIB au Japon et 2,1 % en Iran : 0,7 points de pourcentage de plus en Iran. En 2015, elles représentaient 0,9 % au Japon et 2,6 % en Iran, soit 1,7 points de pourcentage de plus en Iran.
Les dépenses militaires de l'Iran, en part du PIB, sont supérieures à celles du Japon chaque année depuis 1960. L'écart a été le plus grand en 1975, quand les dépenses militaires de l'Iran dépassaient celles du Japon de 11,2 points de pourcentage du PIB.
Japon vs Iran : chiffres des dépenses militaires
|
Japon
|
Iran
|
|
|---|---|---|
| $ US, 2025 | 62,6 Md $US | 7,59 Md $US |
| % du PIB, 2025 | 1,4 % | 2,1 % |
| Par personne, $ US | 508 $US | 82,1 $US |
| Part mondiale | 2,19 % | 0,27 % |
| Rang mondial | 10/154 | 37/154 |
Comparer les dépenses militaires de 2 pays au choix
Sources :
- Banque mondiale | Secteur public (1960–2025, mis à jour en octobre 2026)
Creative Commons Attribution (CC BY) : vous pouvez copier, partager, adapter et réutiliser ce contenu, y compris à des fins commerciales, à condition de citer statistics.wiki et d’indiquer les modifications apportées. Les sources citées ci-dessus peuvent avoir leurs propres conditions de licence.