
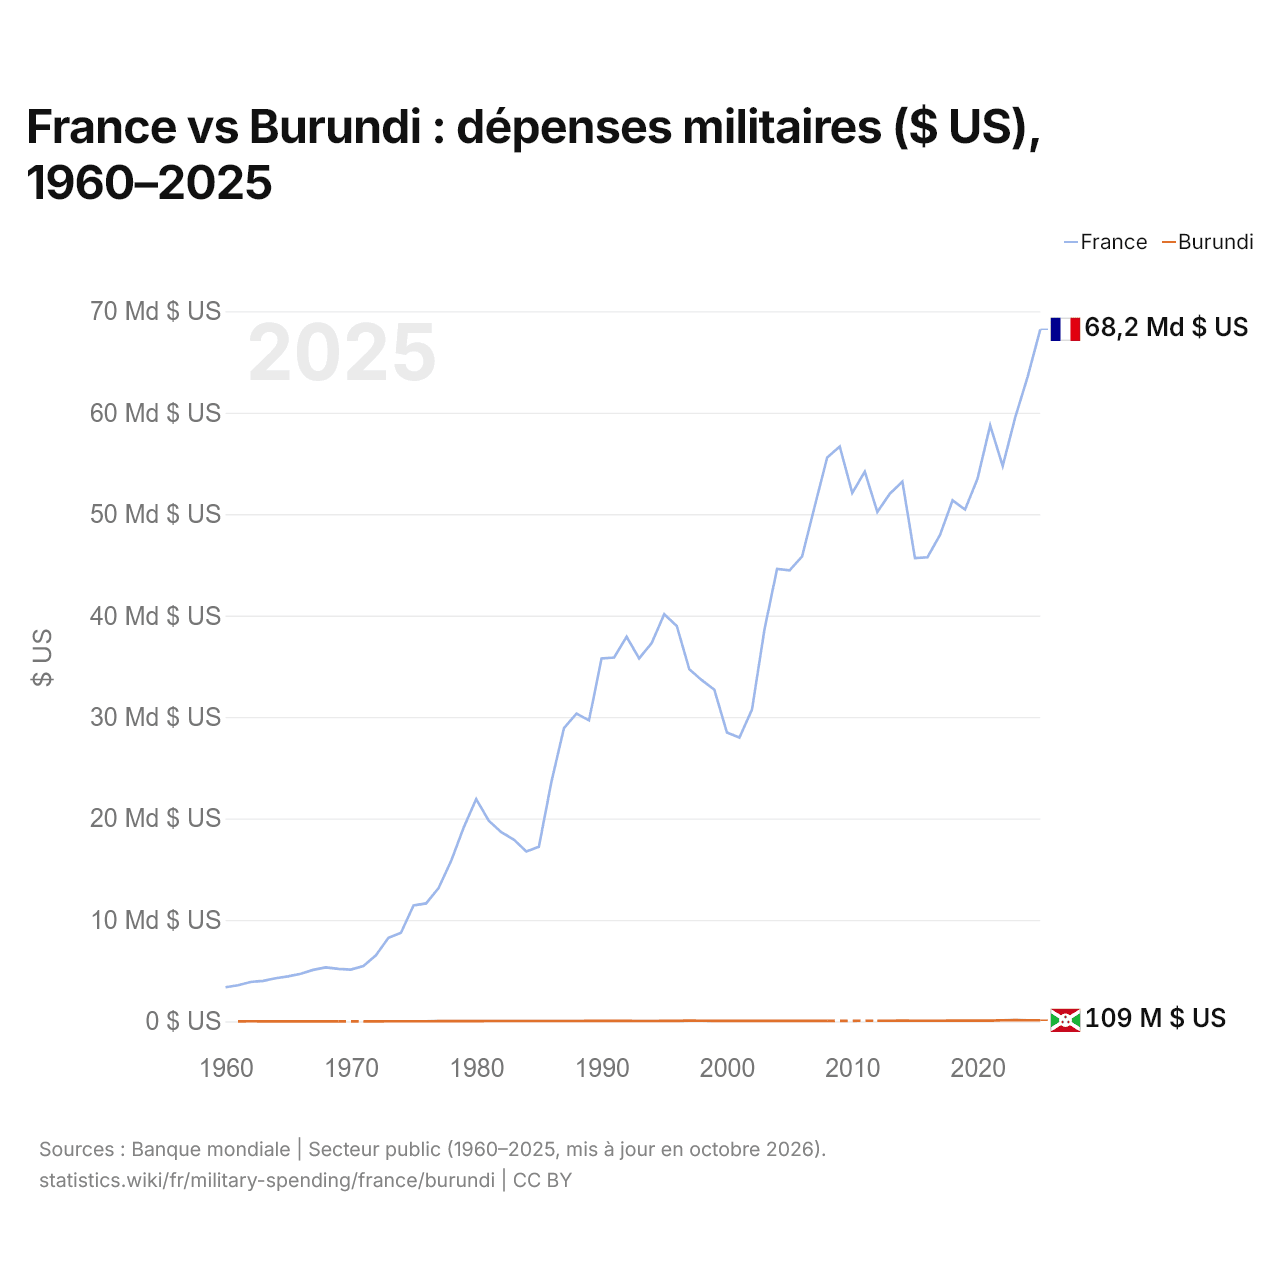
France vs Burundi : dépenses militaires ($ US), 1960–2025
| Année | $ US | |
|---|---|---|
 France |
 Burundi |
|
| 2025 | 68 222 758 116 $ US | 109 097 308 $ US |
| 2024 | 63 574 699 213 $ US | 108 171 835 $ US |
| 2023 | 59 541 138 241 $ US | 117 196 716 $ US |
| 2022 | 54 743 786 501 $ US | 104 359 428 $ US |
| 2021 | 58 741 980 241 $ US | 69 874 459 $ US |
| 2020 | 53 532 447 233 $ US | 69 625 698 $ US |
| 2019 | 50 450 238 260 $ US | 80 715 352 $ US |
| 2018 | 51 349 083 040 $ US | 62 621 435 $ US |
| 2017 | 47 953 836 260 $ US | 56 703 971 $ US |
| 2016 | 45 744 984 945 $ US | 58 728 119 $ US |
| 2015 | 45 667 911 366 $ US | 59 901 448 $ US |
| 2014 | 53 205 517 148 $ US | 62 178 424 $ US |
| 2013 | 52 016 233 686 $ US | 60 859 452 $ US |
| 2012 | 50 213 660 859 $ US | 58 817 594 $ US |
| 2011 | 54 191 767 779 $ US | - |
| 2010 | 52 094 842 067 $ US | - |
| 2009 | 56 668 596 297 $ US | - |
| 2008 | 55 590 086 701 $ US | 43 856 289 $ US |
| 2007 | 50 751 539 844 $ US | 46 308 720 $ US |
| 2006 | 45 832 871 456 $ US | 44 717 348 $ US |
| 2005 | 44 459 732 673 $ US | 49 557 259 $ US |
| 2004 | 44 604 518 563 $ US | 44 877 509 $ US |
| 2003 | 38 655 763 912 $ US | 43 418 346 $ US |
| 2002 | 30 722 709 468 $ US | 44 915 319 $ US |
| 2001 | 27 976 022 701 $ US | 53 236 671 $ US |
| 2000 | 28 473 836 086 $ US | 42 326 534 $ US |
| 1999 | 32 684 690 466 $ US | 50 566 593 $ US |
| 1998 | 33 632 626 394 $ US | 58 741 049 $ US |
| 1997 | 34 697 826 108 $ US | 61 872 826 $ US |
| 1996 | 38 975 535 069 $ US | 50 898 313 $ US |
| 1995 | 40 126 502 557 $ US | 42 108 760 $ US |
| 1994 | 37 288 782 282 $ US | 36 271 478 $ US |
| 1993 | 35 773 367 267 $ US | 34 919 722 $ US |
| 1992 | 37 904 007 595 $ US | 38 942 113 $ US |
| 1991 | 35 870 580 535 $ US | 44 200 868 $ US |
| 1990 | 35 775 593 932 $ US | 39 042 917 $ US |
| 1989 | 29 666 857 390 $ US | 37 311 135 $ US |
| 1988 | 30 328 272 633 $ US | 34 044 235 $ US |
| 1987 | 28 905 394 007 $ US | 29 974 130 $ US |
| 1986 | 23 604 454 136 $ US | 33 713 365 $ US |
| 1985 | 17 204 259 928 $ US | 31 637 916 $ US |
| 1984 | 16 734 750 784 $ US | 29 371 488 $ US |
| 1983 | 17 912 873 034 $ US | 33 622 793 $ US |
| 1982 | 18 638 700 442 $ US | 35 533 956 $ US |
| 1981 | 19 774 946 185 $ US | 29 365 314 $ US |
| 1980 | 21 913 820 113 $ US | 26 845 013 $ US |
| 1979 | 19 094 387 789 $ US | 20 686 984 $ US |
| 1978 | 15 811 781 404 $ US | 17 064 187 $ US |
| 1977 | 13 133 150 147 $ US | 13 871 166 $ US |
| 1976 | 11 626 055 258 $ US | 9 970 911 $ US |
| 1975 | 11 424 177 898 $ US | 8 658 883 $ US |
| 1974 | 8 726 578 188 $ US | 7 682 398 $ US |
| 1973 | 8 235 618 059 $ US | 5 923 093 $ US |
| 1972 | 6 516 780 355 $ US | 3 600 067 $ US |
| 1971 | 5 461 413 281 $ US | 2 610 366 $ US |
| 1970 | 5 094 900 347 $ US | - |
| 1969 | 5 175 972 443 $ US | 3 337 143 $ US |
| 1968 | 5 324 558 222 $ US | 2 590 857 $ US |
| 1967 | 5 072 197 325 $ US | 2 376 000 $ US |
| 1966 | 4 689 371 616 $ US | 2 286 920 $ US |
| 1965 | 4 436 093 512 $ US | 2 150 148 $ US |
| 1964 | 4 241 691 579 $ US | 1 161 955 $ US |
| 1963 | 3 992 460 753 $ US | 1 011 957 $ US |
| 1962 | 3 879 315 476 $ US | 8 420 000 $ US |
| 1961 | 3 556 426 770 $ US | 380 000 $ US |
| 1960 | 3 363 440 232 $ US | - |
En 2025, les dépenses militaires s'élevaient à 68,2 milliards de dollars en France et à 109 millions de dollars au Burundi : 630 fois plus en France. En 1961, elles s'élevaient à 3,56 milliards de dollars en France et à 380 000 dollars au Burundi, soit 9 400 fois plus en France.
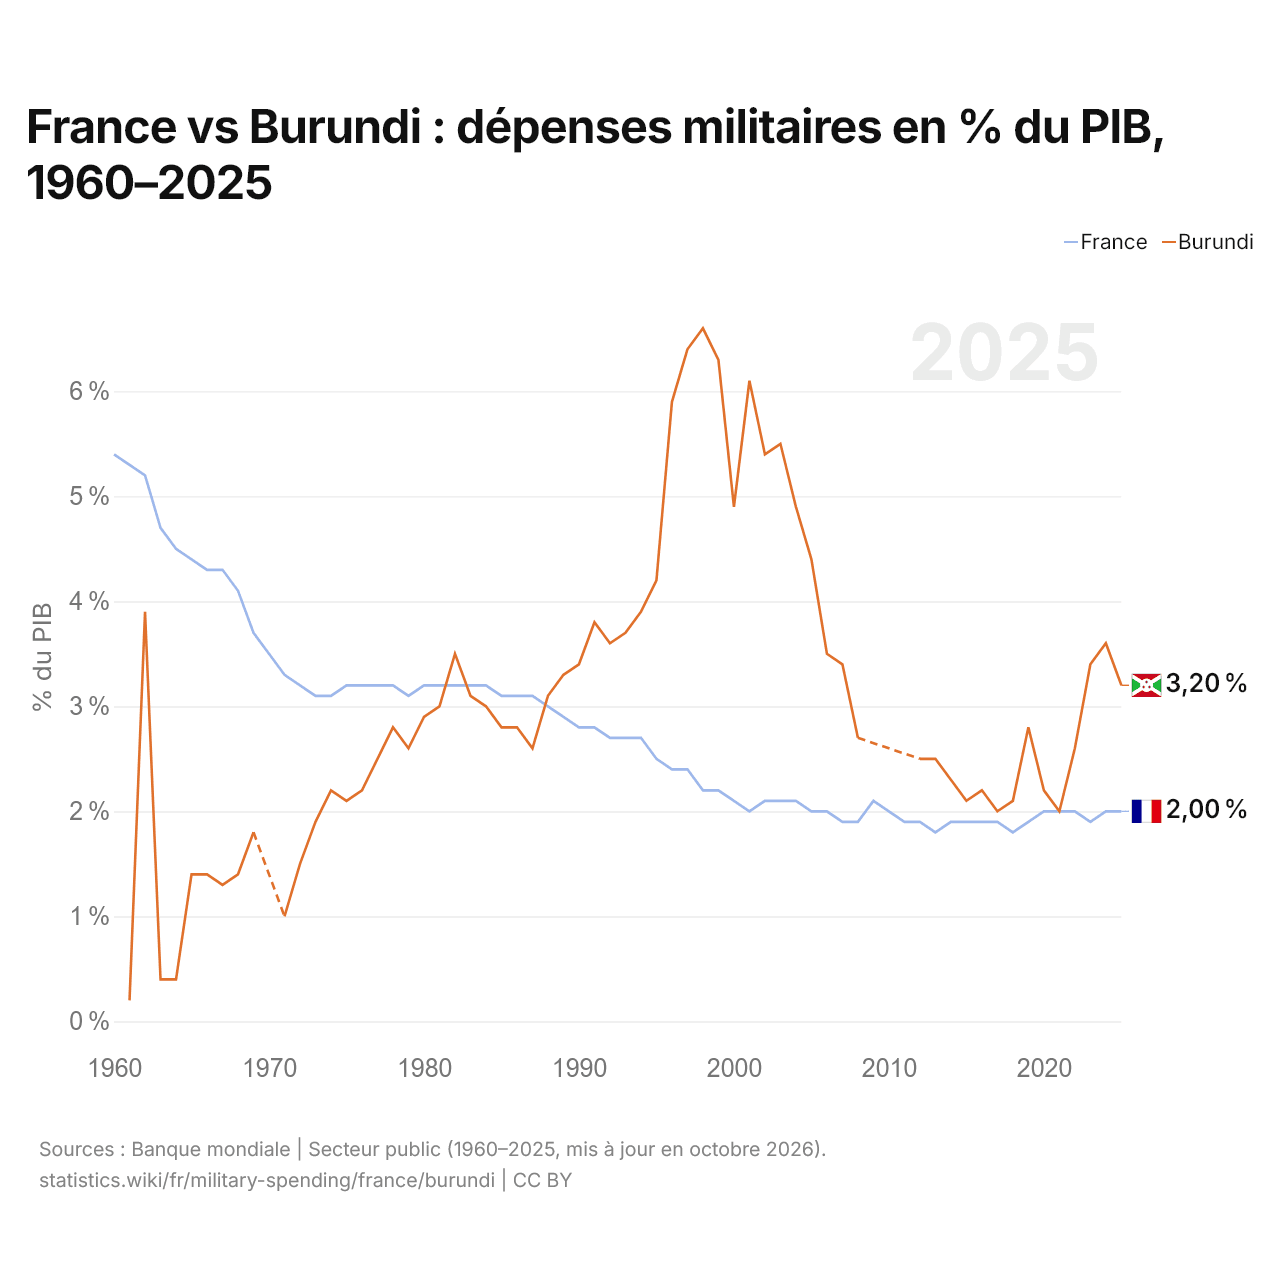
France vs Burundi : dépenses militaires en % du PIB, 1960–2025
| Année | % du PIB | |
|---|---|---|
|
France
|
Burundi
|
|
| 2025 | 2 % | 3,2 % |
| 2024 | 2 % | 3,6 % |
| 2023 | 1,9 % | 3,4 % |
| 2022 | 2 % | 2,6 % |
| 2021 | 2 % | 2 % |
| 2020 | 2 % | 2,2 % |
| 2019 | 1,9 % | 2,8 % |
| 2018 | 1,8 % | 2,1 % |
| 2017 | 1,9 % | 2 % |
| 2016 | 1,9 % | 2,2 % |
| 2015 | 1,9 % | 2,1 % |
| 2014 | 1,9 % | 2,3 % |
| 2013 | 1,8 % | 2,5 % |
| 2012 | 1,9 % | 2,5 % |
| 2011 | 1,9 % | - |
| 2010 | 2 % | - |
| 2009 | 2,1 % | - |
| 2008 | 1,9 % | 2,7 % |
| 2007 | 1,9 % | 3,4 % |
| 2006 | 2 % | 3,5 % |
| 2005 | 2 % | 4,4 % |
| 2004 | 2,1 % | 4,9 % |
| 2003 | 2,1 % | 5,5 % |
| 2002 | 2,1 % | 5,4 % |
| 2001 | 2 % | 6,1 % |
| 2000 | 2,1 % | 4,9 % |
| 1999 | 2,2 % | 6,3 % |
| 1998 | 2,2 % | 6,6 % |
| 1997 | 2,4 % | 6,4 % |
| 1996 | 2,4 % | 5,9 % |
| 1995 | 2,5 % | 4,2 % |
| 1994 | 2,7 % | 3,9 % |
| 1993 | 2,7 % | 3,7 % |
| 1992 | 2,7 % | 3,6 % |
| 1991 | 2,8 % | 3,8 % |
| 1990 | 2,8 % | 3,4 % |
| 1989 | 2,9 % | 3,3 % |
| 1988 | 3 % | 3,1 % |
| 1987 | 3,1 % | 2,6 % |
| 1986 | 3,1 % | 2,8 % |
| 1985 | 3,1 % | 2,8 % |
| 1984 | 3,2 % | 3 % |
| 1983 | 3,2 % | 3,1 % |
| 1982 | 3,2 % | 3,5 % |
| 1981 | 3,2 % | 3 % |
| 1980 | 3,2 % | 2,9 % |
| 1979 | 3,1 % | 2,6 % |
| 1978 | 3,2 % | 2,8 % |
| 1977 | 3,2 % | 2,5 % |
| 1976 | 3,2 % | 2,2 % |
| 1975 | 3,2 % | 2,1 % |
| 1974 | 3,1 % | 2,2 % |
| 1973 | 3,1 % | 1,9 % |
| 1972 | 3,2 % | 1,5 % |
| 1971 | 3,3 % | 1 % |
| 1970 | 3,5 % | - |
| 1969 | 3,7 % | 1,8 % |
| 1968 | 4,1 % | 1,4 % |
| 1967 | 4,3 % | 1,3 % |
| 1966 | 4,3 % | 1,4 % |
| 1965 | 4,4 % | 1,4 % |
| 1964 | 4,5 % | 0,4 % |
| 1963 | 4,7 % | 0,4 % |
| 1962 | 5,2 % | 3,9 % |
| 1961 | 5,3 % | 0,2 % |
| 1960 | 5,4 % | - |
En 2025, les dépenses militaires représentaient 2,0 % du PIB en France et 3,2 % au Burundi : 1,2 points de pourcentage de plus au Burundi. En 2015, elles représentaient 1,9 % en France et 2,1 % au Burundi, soit 0,2 points de pourcentage de plus au Burundi.
Les dépenses militaires du Burundi, en part du PIB, sont supérieures à celles de la France chaque année depuis 2022.
France vs Burundi : chiffres des dépenses militaires
|
France
|
Burundi
|
|
|---|---|---|
| $ US, 2025 | 68,2 Md $US | 109 M $US |
| % du PIB, 2025 | 2,0 % | 3,2 % |
| Par personne, $ US | 993 $US | 7,58 $US |
| Part mondiale | 2,39 % | 0,004 % |
| Rang mondial | 9/154 | 138/154 |
Comparer les dépenses militaires de 2 pays au choix
Sources :
- Banque mondiale | Secteur public (1960–2025, mis à jour en octobre 2026)
Creative Commons Attribution (CC BY) : vous pouvez copier, partager, adapter et réutiliser ce contenu, y compris à des fins commerciales, à condition de citer statistics.wiki et d’indiquer les modifications apportées. Les sources citées ci-dessus peuvent avoir leurs propres conditions de licence.