
Taux d'alphabétisation des adultes par pays (% des personnes de 15 ans ou plus)
| Rang | Pays | Taux d'alphabétisation | Année | Source |
|---|---|---|---|---|
 Monde |
87,7 % | 2024 | UNESCO | |
| 1 |  Tuvalu |
100,0 % | 2022 | UNESCO |
| 1 |  Ukraine |
100,0 % | 2021 | UNESCO |
| 1 |  Ouzbékistan |
100,0 % | 2022 | UNESCO |
| 4 |  Corée du Nord |
100,0 % | 2018 | UNESCO |
| 5 |  Russie |
99,9 % | 2021 | UNESCO |
| 6 |  Saint-Marin |
99,9 % | 2022 | UNESCO |
| 7 |  Turkménistan |
99,9 % | 2022 | UNESCO |
| 8 |  Lettonie |
99,9 % | 2021 | UNESCO |
| 9 |  Biélorussie |
99,9 % | 2019 | UNESCO |
| 9 |  Estonie |
99,9 % | 2021 | UNESCO |
| 11 |  Palaos |
99,8 % | 2020 | UNESCO |
| 12 |  Arménie |
99,8 % | 2023 | UNESCO |
| 13 |  Lituanie |
99,8 % | 2021 | UNESCO |
| 14 |  Kazakhstan |
99,8 % | 2020 | UNESCO |
| 14 |  Pologne |
99,8 % | 2021 | UNESCO |
| 16 |  Azerbaïdjan |
99,8 % | 2023 | UNESCO |
| 17 |  Espagne |
99,7 % | 2021 | UNESCO |
| 18 |  Géorgie |
99,7 % | 2024 | UNESCO |
| 19 |  Cuba |
99,7 % | 2021 | UNESCO |
| 20 |  Kirghizistan |
99,6 % | 2019 | UNESCO |
| 20 |  Moldavie |
99,6 % | 2021 | UNESCO |
| 22 |  Tonga |
99,5 % | 2023 | UNESCO |
| 23 |  Croatie |
99,4 % | 2021 | UNESCO |
| 24 |  Chypre |
99,4 % | 2021 | UNESCO |
| 25 |  Italie |
99,3 % | 2019 | UNESCO |
| 26 |  Serbie |
99,3 % | 2022 | UNESCO |
| 27 |  Roumanie |
99,2 % | 2021 | UNESCO |
| 28 |  Argentine |
99,1 % | 2020 | UNESCO |
| 29 |  Hongrie |
99,1 % | 2021 | UNESCO |
| 29 |  Samoa |
99,1 % | 2021 | UNESCO |
| 31 |  Monténégro |
99,0 % | 2021 | UNESCO |
| 32 |  Uruguay |
98,9 % | 2024 | UNESCO |
| 33 |  Îles Caïmans |
98,9 % | 2017 | UNESCO |
| 34 |  EAU |
98,8 % | 2024 | UNESCO |
| 35 |  Corée du Sud |
98,8 % | 2018 | UNESCO |
| 36 |  Mongolie |
98,6 % | 2024 | UNESCO |
| 37 |  Kiribati |
98,6 % | 2020 | UNESCO |
| 38 |  Philippines |
98,5 % | 2020 | UNESCO |
| 39 |  Bulgarie |
98,4 % | 2021 | UNESCO |
| 40 |  Bosnie-Herzégovine |
98,3 % | 2022 | UNESCO |
| 41 |  Costa Rica |
98,0 % | 2021 | UNESCO |
| 42 |  Palestine |
97,9 % | 2024 | UNESCO |
| 43 |  Arabie saoudite |
97,9 % | 2024 | UNESCO |
| 44 |  Maldives |
97,9 % | 2021 | UNESCO |
| 45 |  Bahreïn |
97,8 % | 2024 | UNESCO |
| 46 |  Albanie |
97,7 % | 2023 | UNESCO |
| 47 |  Singapour |
97,7 % | 2021 | UNESCO |
| 48 |  Venezuela |
97,6 % | 2022 | UNESCO |
| 49 |  Brunei |
97,6 % | 2021 | UNESCO |
| 50 |  Oman |
97,3 % | 2022 | UNESCO |
| 51 |  Turquie |
97,3 % | 2021 | UNESCO |
| 52 |  Chili |
97,2 % | 2022 | UNESCO |
| 53 |  Portugal |
96,8 % | 2021 | UNESCO |
| 54 |  Chine |
96,7 % | 2020 | UNESCO |
| 55 |  Bolivie |
96,7 % | 2024 | UNESCO |
| 56 |  Nauru |
96,6 % | 2023 | UNESCO |
| 57 |  Koweït |
96,5 % | 2020 | UNESCO |
| 58 |  Panama |
96,2 % | 2024 | UNESCO |
| 59 |  Seychelles |
96,2 % | 2020 | UNESCO |
| 60 |  Vietnam |
96,1 % | 2022 | UNESCO |
| 61 |  Indonésie |
96,0 % | 2020 | UNESCO |
| 62 |  Mexique |
95,9 % | 2025 | UNESCO |
| 63 |  Malaisie |
95,8 % | 2022 | UNESCO |
| 64 |  Îles Marshall |
95,8 % | 2021 | UNESCO |
| 65 |  Colombie |
95,3 % | 2024 | UNESCO |
| 66 |  Suriname |
95,0 % | 2021 | UNESCO |
| 67 |  Malte |
94,9 % | 2021 | UNESCO |
| 68 |  Paraguay |
94,9 % | 2024 | UNESCO |
| 69 |  Brésil |
94,7 % | 2024 | UNESCO |
| 70 |  Jordanie |
94,4 % | 2024 | UNESCO |
| 71 |  Syrie |
94,4 % | 2021 | UNESCO |
| 72 |  Maurice |
94,3 % | 2023 | UNESCO |
| 73 |  Rép. dominicaine |
94,0 % | 2024 | UNESCO |
| 74 |  Sao Tomé |
93,8 % | 2022 | UNESCO |
| 75 |  Pérou |
93,7 % | 2024 | UNESCO |
| 76 |  Birmanie |
93,5 % | 2020 | UNESCO |
| 77 |  Équateur |
93,5 % | 2024 | UNESCO |
| 78 |  Sri Lanka |
92,7 % | 2024 | UNESCO |
| 79 |  Liban |
92,0 % | 2019 | UNESCO |
| 80 |  Afrique du Sud |
91,2 % | 2024 | UNESCO |
| 81 |  Thaïlande |
91,1 % | 2022 | UNESCO |
| 82 |  Eswatini |
90,8 % | 2022 | UNESCO |
| 83 |  Lesotho |
90,4 % | 2024 | UNESCO |
| 84 |  Guyana |
90,0 % | 2022 | UNESCO |
| 85 |  Zimbabwe |
89,8 % | 2022 | UNESCO |
| 86 |  Salvador |
89,8 % | 2024 | UNESCO |
| 87 |  Iran |
88,9 % | 2023 | UNESCO |
| 88 |  Cap-Vert |
88,5 % | 2024 | UNESCO |
| 89 |  Honduras |
88,3 % | 2024 | UNESCO |
| 90 |  Vanuatu |
88,0 % | 2023 | UNESCO |
| 91 |  Belize |
87,9 % | 2022 | UNESCO |
| 92 |  Namibie |
87,6 % | 2023 | UNESCO |
| 93 |  Papouasie |
87,0 % | 2022 | UNESCO |
| 94 |  Tunisie |
86,3 % | 2023 | UNESCO |
| 95 |  Gabon |
85,7 % | 2022 | UNESCO |
| 96 |  Irak |
84,1 % | 2021 | UNESCO |
| 97 |  Cambodge |
83,8 % | 2022 | UNESCO |
| 98 |  Kenya |
82,9 % | 2022 | UNESCO |
| 99 |  Nicaragua |
82,6 % | 2015 | UNESCO |
| 100 |  Guatemala |
82,1 % | 2024 | UNESCO |
| 101 |  Algérie |
81,4 % | 2018 | UNESCO |
| 102 |  Congo-Brazza |
80,6 % | 2021 | UNESCO |
| 103 |  Égypte |
79,5 % | 2022 | UNESCO |
| 104 |  Bangladesh |
79,0 % | 2022 | UNESCO |
| 105 |  Rwanda |
78,8 % | 2022 | UNESCO |
| 106 |  Cameroun |
78,2 % | 2020 | UNESCO |
| 107 |  Tanzanie |
78,2 % | 2022 | UNESCO |
| 108 |  Inde |
78,2 % | 2024 | UNESCO |
| 109 |  Madagascar |
77,5 % | 2022 | UNESCO |
| 110 |  Maroc |
77,3 % | 2022 | UNESCO |
| 111 |  Ouganda |
77,0 % | 2024 | UNESCO |
| 112 |  Érythrée |
76,6 % | 2018 | UNESCO |
| 113 |  Ghana |
76,5 % | 2021 | UNESCO |
| 114 |  Laos |
75,6 % | 2023 | UNESCO |
| 115 |  Burundi |
75,5 % | 2022 | UNESCO |
| 116 |  Togo |
72,6 % | 2022 | UNESCO |
| 117 |  Zambie |
71,8 % | 2024 | UNESCO |
| 118 |  Népal |
71,2 % | 2021 | UNESCO |
| 119 |  Nigeria |
70,4 % | 2024 | UNESCO |
| 120 |  Timor oriental |
69,4 % | 2022 | UNESCO |
| 121 |  RDC |
68,5 % | 2023 | UNESCO |
| 122 |  Angola |
68,2 % | 2023 | UNESCO |
| 123 |  Malawi |
68,1 % | 2022 | UNESCO |
| 124 |  Haïti |
68,0 % | 2017 | UNESCO |
| 125 |  Mauritanie |
67,0 % | 2021 | UNESCO |
| 126 |  Bhoutan |
64,9 % | 2022 | UNESCO |
| 127 |  Guinée-Bissau |
63,9 % | 2022 | UNESCO |
| 128 |  Comores |
61,7 % | 2022 | UNESCO |
| 129 |  Mozambique |
61,7 % | 2022 | UNESCO |
| 130 |  Soudan |
60,7 % | 2018 | UNESCO |
| 131 |  Éthiopie |
60,5 % | 2022 | UNESCO |
| 132 |  Pakistan |
58,9 % | 2021 | UNESCO |
| 133 |  Gambie |
58,7 % | 2022 | UNESCO |
| 134 |  Somalie |
54,1 % | 2022 | UNESCO |
| 135 |  Bénin |
51,4 % | 2022 | UNESCO |
| 136 |  Sénégal |
50,4 % | 2023 | UNESCO |
| 137 |  Côte d’Ivoire |
50,0 % | 2021 | UNESCO |
| 138 |  Sierra Leone |
48,6 % | 2022 | UNESCO |
| 139 |  Liberia |
48,3 % | 2017 | UNESCO |
| 140 |  Guinée |
45,3 % | 2021 | UNESCO |
| 141 |  Burkina Faso |
41,6 % | 2023 | UNESCO |
| 142 |  RCA |
37,5 % | 2020 | UNESCO |
| 143 |  Afghanistan |
37,3 % | 2021 | UNESCO |
| 144 |  Mali |
35,6 % | 2024 | UNESCO |
| 145 |  Niger |
35,6 % | 2022 | UNESCO |
| 146 |  Soudan du Sud |
34,5 % | 2018 | UNESCO |
| 147 |  Tchad |
27,3 % | 2022 | UNESCO |
| Non classés : données de l'UNESCO antérieures à 2015 ou estimations du CIA World Factbook | ||||
 Andorre |
100,0 % | 2016 | Estimation du CIA World Factbook | |
 Finlande |
100,0 % | 2000 | Estimation du CIA World Factbook | |
 Liechtenstein |
100,0 % | 2013 | Estimation du CIA World Factbook | |
 Luxembourg |
100,0 % | 2000 | Estimation du CIA World Factbook | |
 Vatican |
100,0 % | 2013 | Estimation du CIA World Factbook | |
 Tadjikistan |
99,7 % | 2010 | UNESCO | |
 Slovaquie |
99,6 % | 2004 | Estimation du CIA World Factbook | |
 Slovénie |
99,6 % | 2001 | UNESCO | |
 Barbade |
99,5 % | 1980 | UNESCO | |
 Fidji |
99,1 % | 2018 | Estimation du CIA World Factbook | |
 Antigua-et-Barbuda |
99,0 % | 2015 | Estimation du CIA World Factbook | |
 Australie |
99,0 % | 2003 | Estimation du CIA World Factbook | |
 Belgique |
99,0 % | 2003 | Estimation du CIA World Factbook | |
 Canada |
99,0 % | 2003 | Estimation du CIA World Factbook | |
 Tchéquie |
99,0 % | 2011 | Estimation du CIA World Factbook | |
 Danemark |
99,0 % | 2003 | Estimation du CIA World Factbook | |
 France |
99,0 % | 2003 | Estimation du CIA World Factbook | |
 Allemagne |
99,0 % | 2003 | Estimation du CIA World Factbook | |
 Islande |
99,0 % | 2003 | Estimation du CIA World Factbook | |
 Irlande |
99,0 % | 2003 | Estimation du CIA World Factbook | |
 Japon |
99,0 % | 2002 | Estimation du CIA World Factbook | |
 Monaco |
99,0 % | 2003 | Estimation du CIA World Factbook | |
 Pays-Bas |
99,0 % | 2003 | Estimation du CIA World Factbook | |
 Nouvelle-Zélande |
99,0 % | 2003 | Estimation du CIA World Factbook | |
 Suède |
99,0 % | 2003 | Estimation du CIA World Factbook | |
 Suisse |
99,0 % | 2003 | Estimation du CIA World Factbook | |
 Royaume-Uni |
99,0 % | 2003 | Estimation du CIA World Factbook | |
 États-Unis |
99,0 % | 2003 | Estimation du CIA World Factbook | |
 Taïwan |
98,5 % | 2014 | Estimation du CIA World Factbook | |
 Grenade |
98,4 % | 1980 | UNESCO | |
 Autriche |
98,0 % | 2013 | Estimation du CIA World Factbook | |
 Trinité-et-Tobago |
97,9 % | 2000 | UNESCO | |
 Israël |
97,8 % | 2011 | Estimation du CIA World Factbook | |
 Saint-Christophe |
97,8 % | 2003 | Estimation du CIA World Factbook | |
 Qatar |
97,8 % | 2014 | UNESCO | |
 Macédoine du Nord |
97,6 % | 2012 | UNESCO | |
 Saint-Vincent |
96,9 % | 1980 | UNESCO | |
 Bahamas |
95,6 % | 2003 | Estimation du CIA World Factbook | |
 Norvège |
95,0 % | 2013 | Estimation du CIA World Factbook | |
 Guinée équatoriale |
94,4 % | 2010 | UNESCO | |
 Dominique |
94,0 % | 2003 | Estimation du CIA World Factbook | |
 Grèce |
93,9 % | 2009 | UNESCO | |
 Sainte-Lucie |
90,1 % | 2001 | Estimation du CIA World Factbook | |
 Jamaïque |
88,7 % | 2015 | Estimation du CIA World Factbook | |
 Botswana |
86,8 % | 2013 | UNESCO | |
 Îles Salomon |
84,1 % | 2013 | Estimation du CIA World Factbook | |
 Libye |
76,5 % | 1994 | UNESCO | |
 Djibouti |
67,9 % | 2003 | Estimation du CIA World Factbook | |
 Yémen |
54,1 % | 2004 | UNESCO | |
Sur les 147 pays classés selon les dernières estimations de l'UNESCO, le taux d'alphabétisation des adultes est le plus élevé à Tuvalu, avec 100,0 %, et le plus bas au Tchad, avec 27,3 %. Dans la moitié d'entre eux, il est inférieur à 93,8 %.
Le taux d'alphabétisation des adultes est la part des personnes de 15 ans ou plus qui savent lire et écrire une phrase courte et simple sur leur vie quotidienne. L'UNESCO l'établit à partir des recensements et des enquêtes nationales auprès des ménages, si bien que le dernier taux de chaque pays a sa propre année. Le tableau classe les taux antérieurs d'au plus dix ans au plus récent ; les taux plus anciens de l'UNESCO et les estimations du CIA World Factbook figurent en dessous, sans rang.
Les 10 pays au taux d'alphabétisation le plus bas
Les 10 pays au taux d'alphabétisation le plus élevé
-
Tuvalu
-
Ukraine
-
Ouzbékistan
-
Corée du Nord
-
Russie
-
Saint-Marin
-
Turkménistan
-
Lettonie
-
Biélorussie
-
Estonie
Sur les dix pays aux taux les plus bas, neuf se trouvent en Afrique ; sur les dix aux taux les plus élevés, six se trouvent en Europe.
Carte du taux d'alphabétisation des adultes par pays, dernières données
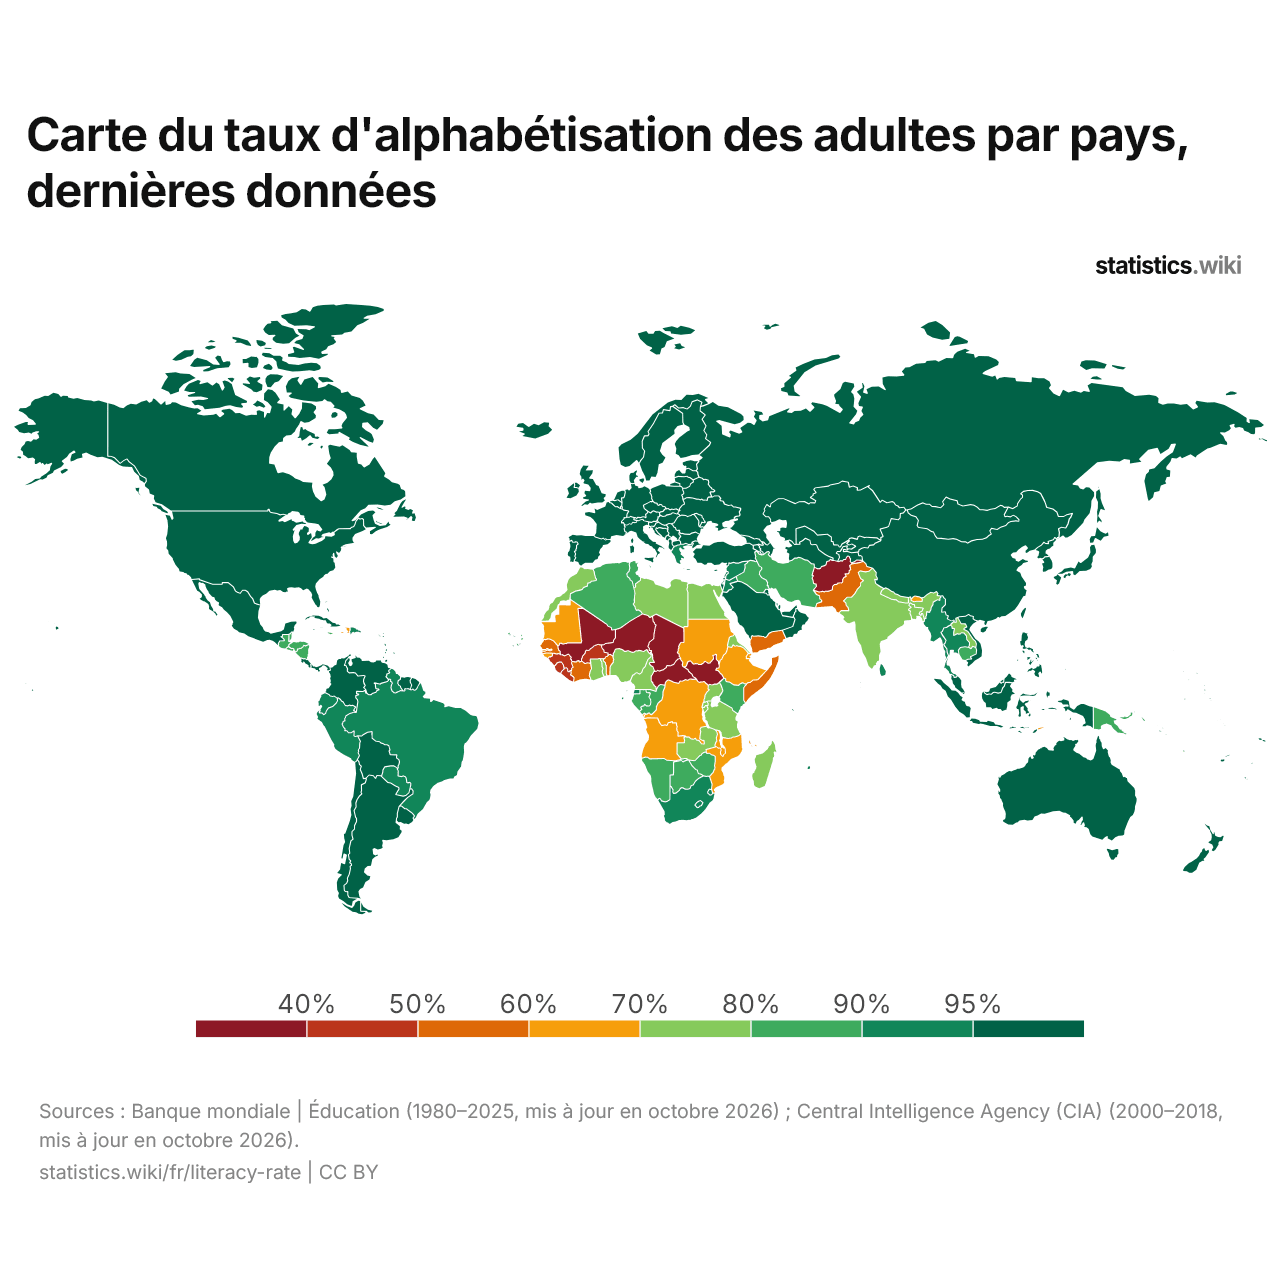
Sur les 196 pays de la carte, le taux d'alphabétisation des adultes dépasse 95 % dans 105 et est inférieur à 50 % dans 10.
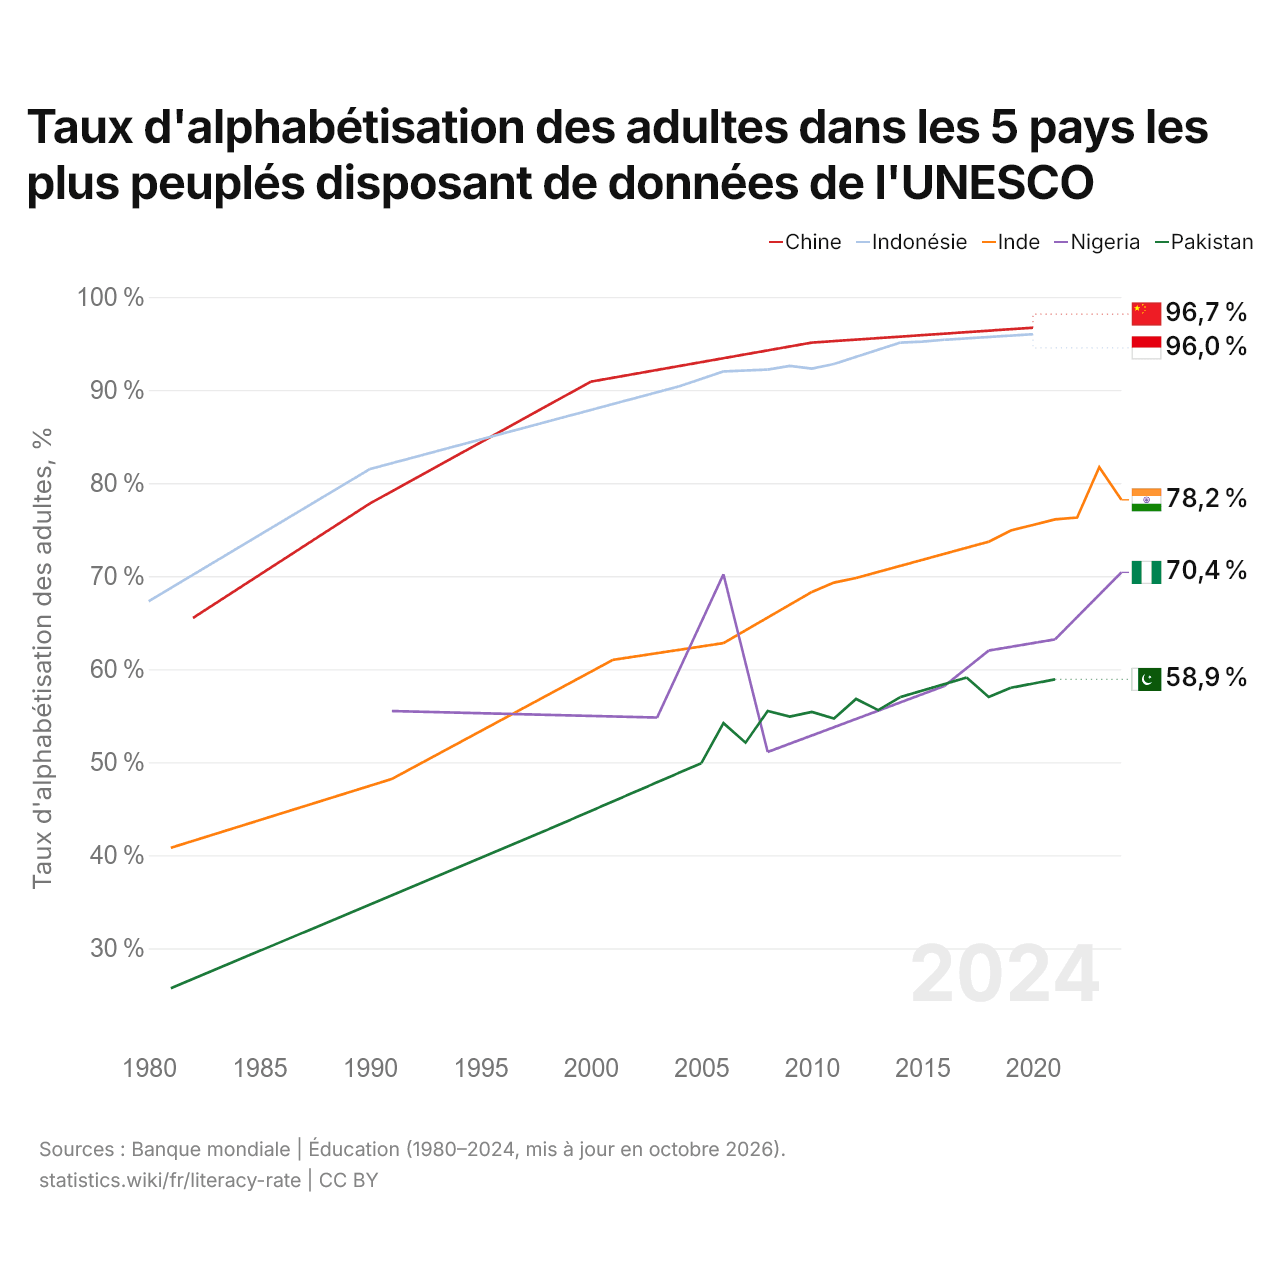
Taux d'alphabétisation des adultes dans les 5 pays les plus peuplés disposant de données de l'UNESCO
| Année | Taux d'alphabétisation des adultes, % | ||||
|---|---|---|---|---|---|
| Chine | Indonésie | Inde | Nigeria | Pakistan | |
| 2024 | - | - | 78,2 % | 70,4 % | - |
| 2023 | - | - | 81,7 % | - | - |
| 2022 | - | - | 76,3 % | - | - |
| 2021 | - | - | 76,1 % | 63,2 % | 58,9 % |
| 2020 | 96,7 % | 96 % | 75,5 % | - | - |
| 2019 | - | - | 74,9 % | - | 58 % |
| 2018 | - | 95,7 % | 73,7 % | 62 % | 57 % |
| 2017 | - | - | - | - | 59,1 % |
| 2016 | - | 95,4 % | - | 58,2 % | - |
| 2015 | - | 95,2 % | - | - | - |
| 2014 | - | 95,1 % | - | - | 57 % |
| 2013 | - | - | - | - | 55,6 % |
| 2012 | - | - | 69,8 % | - | 56,8 % |
| 2011 | - | 92,8 % | 69,3 % | - | 54,7 % |
| 2010 | 95,1 % | 92,3 % | 68,3 % | - | 55,4 % |
| 2009 | - | 92,6 % | - | - | 54,9 % |
| 2008 | - | 92,2 % | - | 51,1 % | 55,5 % |
| 2007 | - | - | - | - | 52,1 % |
| 2006 | - | 92 % | 62,8 % | 70,2 % | 54,2 % |
| 2005 | - | - | - | - | 49,9 % |
| 2004 | - | 90,4 % | - | - | - |
| 2003 | - | - | - | 54,8 % | - |
| 2001 | - | - | 61 % | - | - |
| 2000 | 90,9 % | - | - | - | - |
| 1998 | - | - | - | - | 42,7 % |
| 1991 | - | - | 48,2 % | 55,5 % | - |
| 1990 | 77,8 % | 81,5 % | - | - | - |
| 1982 | 65,5 % | - | - | - | - |
| 1981 | - | - | 40,8 % | - | 25,7 % |
| 1980 | - | 67,3 % | - | - | - |
Parmi les cinq pays, le dernier taux d'alphabétisation des adultes est le plus élevé en Chine, avec 96,7 % (2020), et le plus bas au Pakistan, avec 58,9 % (2021). La plus forte variation s'observe en Inde, où il est passé de 40,8 % en 1981 à 78,2 %.
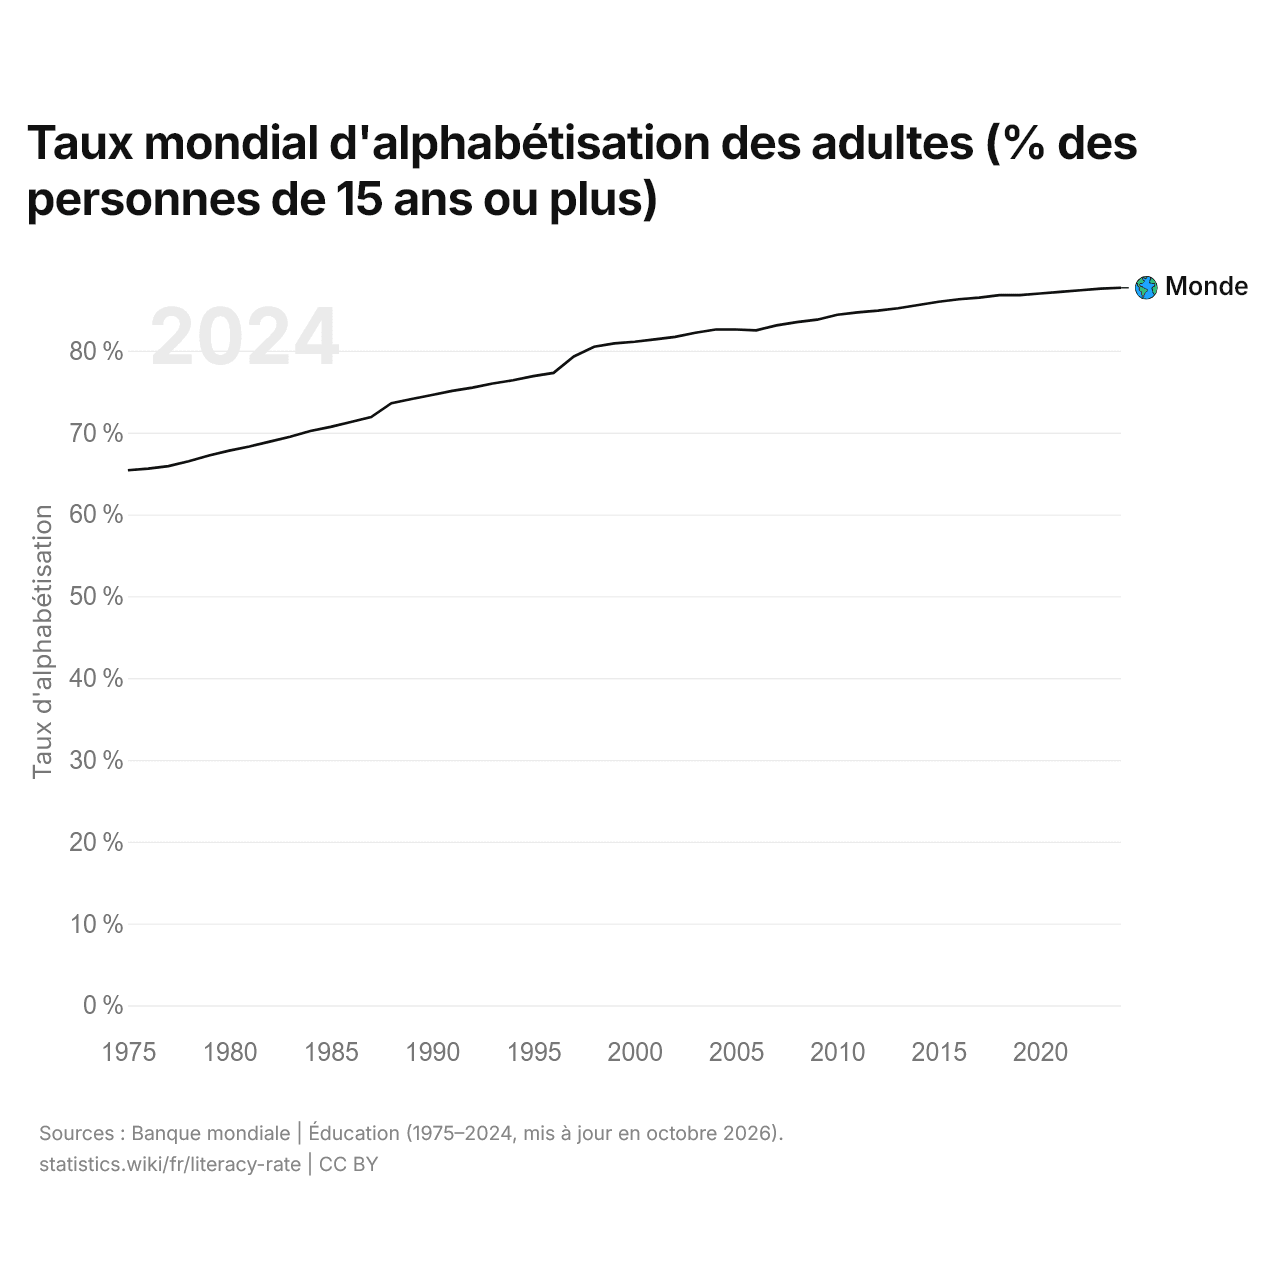
Taux mondial d'alphabétisation des adultes (% des personnes de 15 ans ou plus)
| Année | Taux d'alphabétisation |
|---|---|
| Monde | |
| 2024 | 87,7 % |
| 2023 | 87,6 % |
| 2022 | 87,4 % |
| 2021 | 87,2 % |
| 2020 | 87 % |
| 2019 | 86,8 % |
| 2018 | 86,8 % |
| 2017 | 86,5 % |
| 2016 | 86,3 % |
| 2015 | 86 % |
| 2014 | 85,6 % |
| 2013 | 85,2 % |
| 2012 | 84,9 % |
| 2011 | 84,7 % |
| 2010 | 84,4 % |
| 2009 | 83,8 % |
| 2008 | 83,5 % |
| 2007 | 83,1 % |
| 2006 | 82,5 % |
| 2005 | 82,6 % |
| 2004 | 82,6 % |
| 2003 | 82,2 % |
| 2002 | 81,7 % |
| 2001 | 81,4 % |
| 2000 | 81,1 % |
| 1999 | 80,9 % |
| 1998 | 80,5 % |
| 1997 | 79,3 % |
| 1996 | 77,3 % |
| 1995 | 76,9 % |
| 1994 | 76,4 % |
| 1993 | 76 % |
| 1992 | 75,5 % |
| 1991 | 75,1 % |
| 1990 | 74,6 % |
| 1989 | 74,1 % |
| 1988 | 73,6 % |
| 1987 | 71,9 % |
| 1986 | 71,3 % |
| 1985 | 70,7 % |
| 1984 | 70,2 % |
| 1983 | 69,5 % |
| 1982 | 68,9 % |
| 1981 | 68,3 % |
| 1980 | 67,8 % |
| 1979 | 67,2 % |
| 1978 | 66,5 % |
| 1977 | 65,9 % |
| 1976 | 65,6 % |
| 1975 | 65,4 % |
L'UNESCO estime le taux mondial d'alphabétisation des adultes à 87,7 %, contre 65,4 % en 1975.
Comparer le taux d'alphabétisation de deux pays
Sources :
- Banque mondiale | Éducation (1975–2025, mis à jour en octobre 2026)
- Central Intelligence Agency (CIA) (2000–2018, mis à jour en octobre 2026)
Creative Commons Attribution (CC BY) : vous pouvez copier, partager, adapter et réutiliser ce contenu, y compris à des fins commerciales, à condition de citer statistics.wiki et d’indiquer les modifications apportées. Les sources citées ci-dessus peuvent avoir leurs propres conditions de licence.