
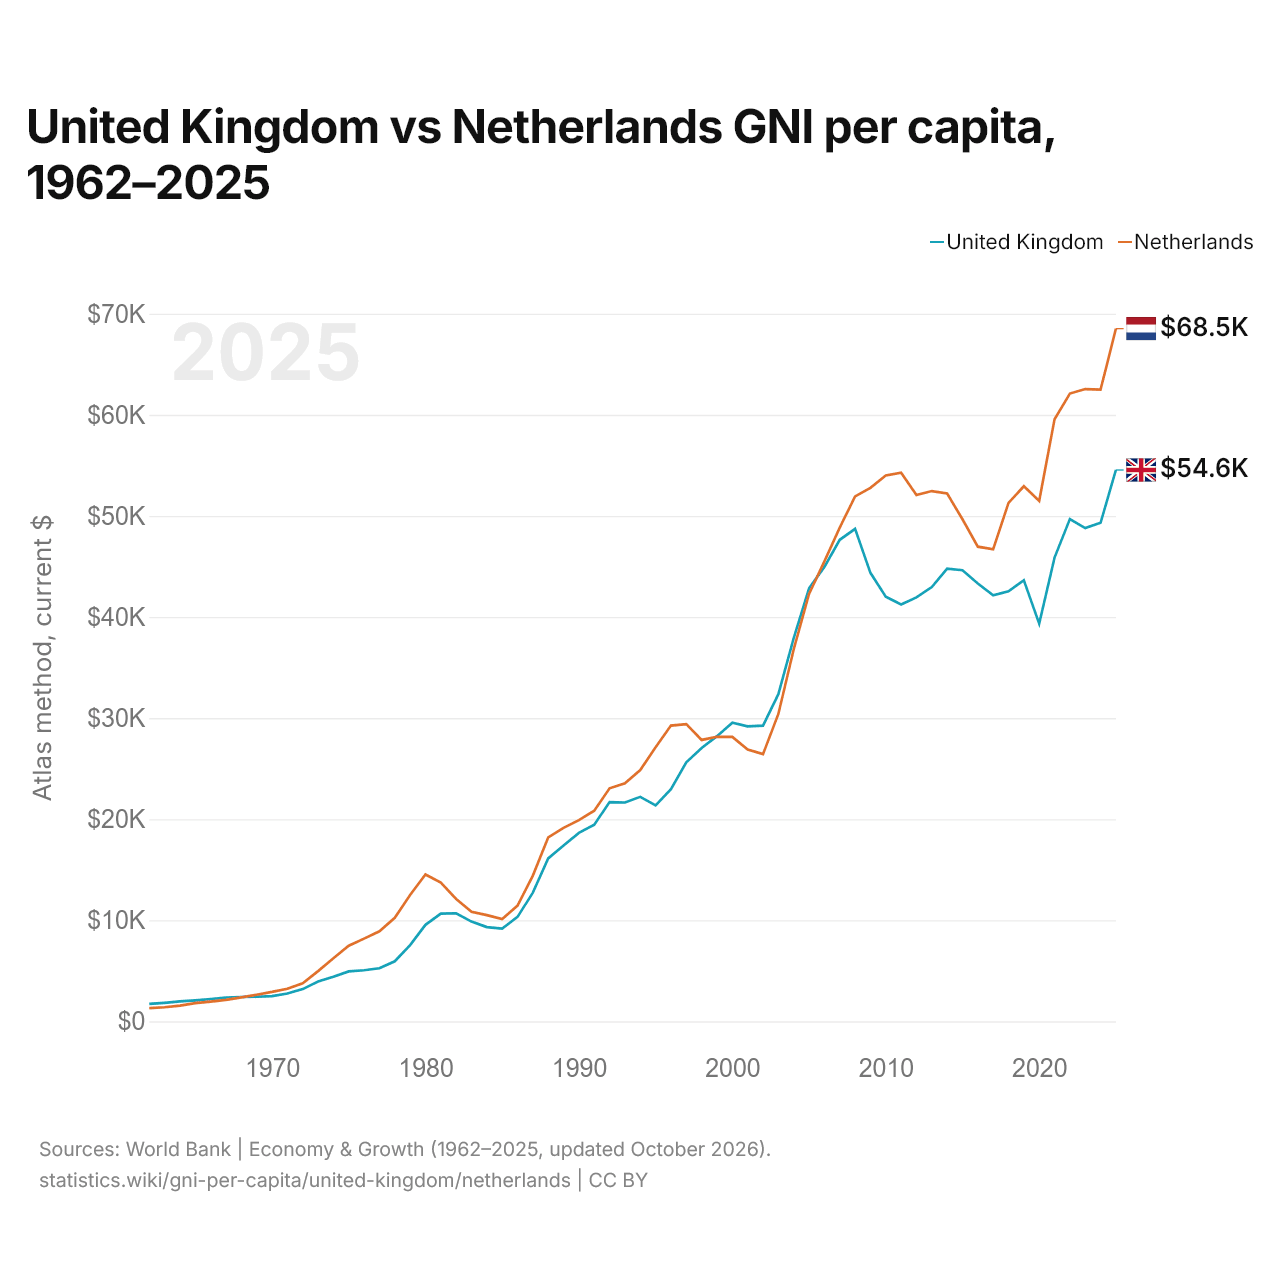
Royaume-Uni vs Pays-Bas : RNB par habitant, 1962–2025
| Année | Méthode Atlas, dollars US courants | |
|---|---|---|
 Royaume-Uni |
 Pays-Bas |
|
| 2025 | 54 550 $ US | 68 530 $ US |
| 2024 | 49 320 $ US | 62 500 $ US |
| 2023 | 48 800 $ US | 62 550 $ US |
| 2022 | 49 690 $ US | 62 110 $ US |
| 2021 | 45 880 $ US | 59 560 $ US |
| 2020 | 39 350 $ US | 51 490 $ US |
| 2019 | 43 640 $ US | 52 940 $ US |
| 2018 | 42 540 $ US | 51 290 $ US |
| 2017 | 42 140 $ US | 46 710 $ US |
| 2016 | 43 310 $ US | 46 960 $ US |
| 2015 | 44 630 $ US | 49 670 $ US |
| 2014 | 44 780 $ US | 52 220 $ US |
| 2013 | 42 960 $ US | 52 460 $ US |
| 2012 | 41 940 $ US | 52 070 $ US |
| 2011 | 41 240 $ US | 54 270 $ US |
| 2010 | 42 010 $ US | 54 000 $ US |
| 2009 | 44 370 $ US | 52 780 $ US |
| 2008 | 48 720 $ US | 51 930 $ US |
| 2007 | 47 640 $ US | 48 840 $ US |
| 2006 | 44 960 $ US | 45 500 $ US |
| 2005 | 42 840 $ US | 42 280 $ US |
| 2004 | 37 910 $ US | 36 800 $ US |
| 2003 | 32 370 $ US | 30 410 $ US |
| 2002 | 29 260 $ US | 26 440 $ US |
| 2001 | 29 190 $ US | 26 900 $ US |
| 2000 | 29 550 $ US | 28 140 $ US |
| 1999 | 28 210 $ US | 28 150 $ US |
| 1998 | 27 040 $ US | 27 840 $ US |
| 1997 | 25 630 $ US | 29 410 $ US |
| 1996 | 22 970 $ US | 29 260 $ US |
| 1995 | 21 360 $ US | 27 120 $ US |
| 1994 | 22 210 $ US | 24 860 $ US |
| 1993 | 21 650 $ US | 23 550 $ US |
| 1992 | 21 690 $ US | 23 050 $ US |
| 1991 | 19 450 $ US | 20 840 $ US |
| 1990 | 18 640 $ US | 19 910 $ US |
| 1989 | 17 390 $ US | 19 140 $ US |
| 1988 | 16 120 $ US | 18 190 $ US |
| 1987 | 12 730 $ US | 14 420 $ US |
| 1986 | 10 330 $ US | 11 450 $ US |
| 1985 | 9 180 $ US | 10 120 $ US |
| 1984 | 9 320 $ US | 10 510 $ US |
| 1983 | 9 870 $ US | 10 840 $ US |
| 1982 | 10 690 $ US | 12 100 $ US |
| 1981 | 10 660 $ US | 13 720 $ US |
| 1980 | 9 550 $ US | 14 530 $ US |
| 1979 | 7 540 $ US | 12 500 $ US |
| 1978 | 5 940 $ US | 10 250 $ US |
| 1977 | 5 250 $ US | 8 910 $ US |
| 1976 | 5 050 $ US | 8 180 $ US |
| 1975 | 4 940 $ US | 7 480 $ US |
| 1974 | 4 420 $ US | 6 240 $ US |
| 1973 | 3 940 $ US | 4 970 $ US |
| 1972 | 3 190 $ US | 3 770 $ US |
| 1971 | 2 750 $ US | 3 230 $ US |
| 1970 | 2 490 $ US | 2 910 $ US |
| 1969 | 2 430 $ US | 2 630 $ US |
| 1968 | 2 410 $ US | 2 370 $ US |
| 1967 | 2 340 $ US | 2 130 $ US |
| 1966 | 2 210 $ US | 1 950 $ US |
| 1965 | 2 080 $ US | 1 800 $ US |
| 1964 | 1 970 $ US | 1 550 $ US |
| 1963 | 1 830 $ US | 1 390 $ US |
| 1962 | 1 720 $ US | 1 300 $ US |
En 2025, le RNB par habitant selon la méthode Atlas était de 54 550 $ US au Royaume-Uni et de 68 530 $ US aux Pays-Bas : 26 % de plus aux Pays-Bas. En 1962, il était de 1 720 $ US au Royaume-Uni et de 1 300 $ US aux Pays-Bas, soit 32 % de plus au Royaume-Uni.
Le RNB par habitant des Pays-Bas est plus élevé que celui du Royaume-Uni chaque année depuis 2006. Converti selon la parité de pouvoir d'achat, le RNB par habitant était de 64 210 dollars au Royaume-Uni et de 85 480 dollars aux Pays-Bas en 2025 : 33 % de plus aux Pays-Bas.
Royaume-Uni vs Pays-Bas : derniers chiffres du RNB par habitant
|
Royaume-Uni
|
Pays-Bas
|
|
|---|---|---|
| Méthode Atlas, dollars US courants | 54 550 $US | 68 530 $US |
| Rang mondial | 21/194 | 12/194 |
| PPA, dollars internationaux | 64 210 $US | 85 480 $US |
| Groupe de revenu | Revenu élevé | Revenu élevé |
| Écart de RNB par habitant | 0,8× | 1,3× |
Comparer le RNB par habitant de 2 pays au choix
Sources :
- Banque mondiale | Économie et croissance (1962–2025, mis à jour en octobre 2026)
Creative Commons Attribution (CC BY) : vous pouvez copier, partager, adapter et réutiliser ce contenu, y compris à des fins commerciales, à condition de citer statistics.wiki et d’indiquer les modifications apportées. Les sources citées ci-dessus peuvent avoir leurs propres conditions de licence.