
Turquie vs Espagne : RNB par habitant, 1962–2025
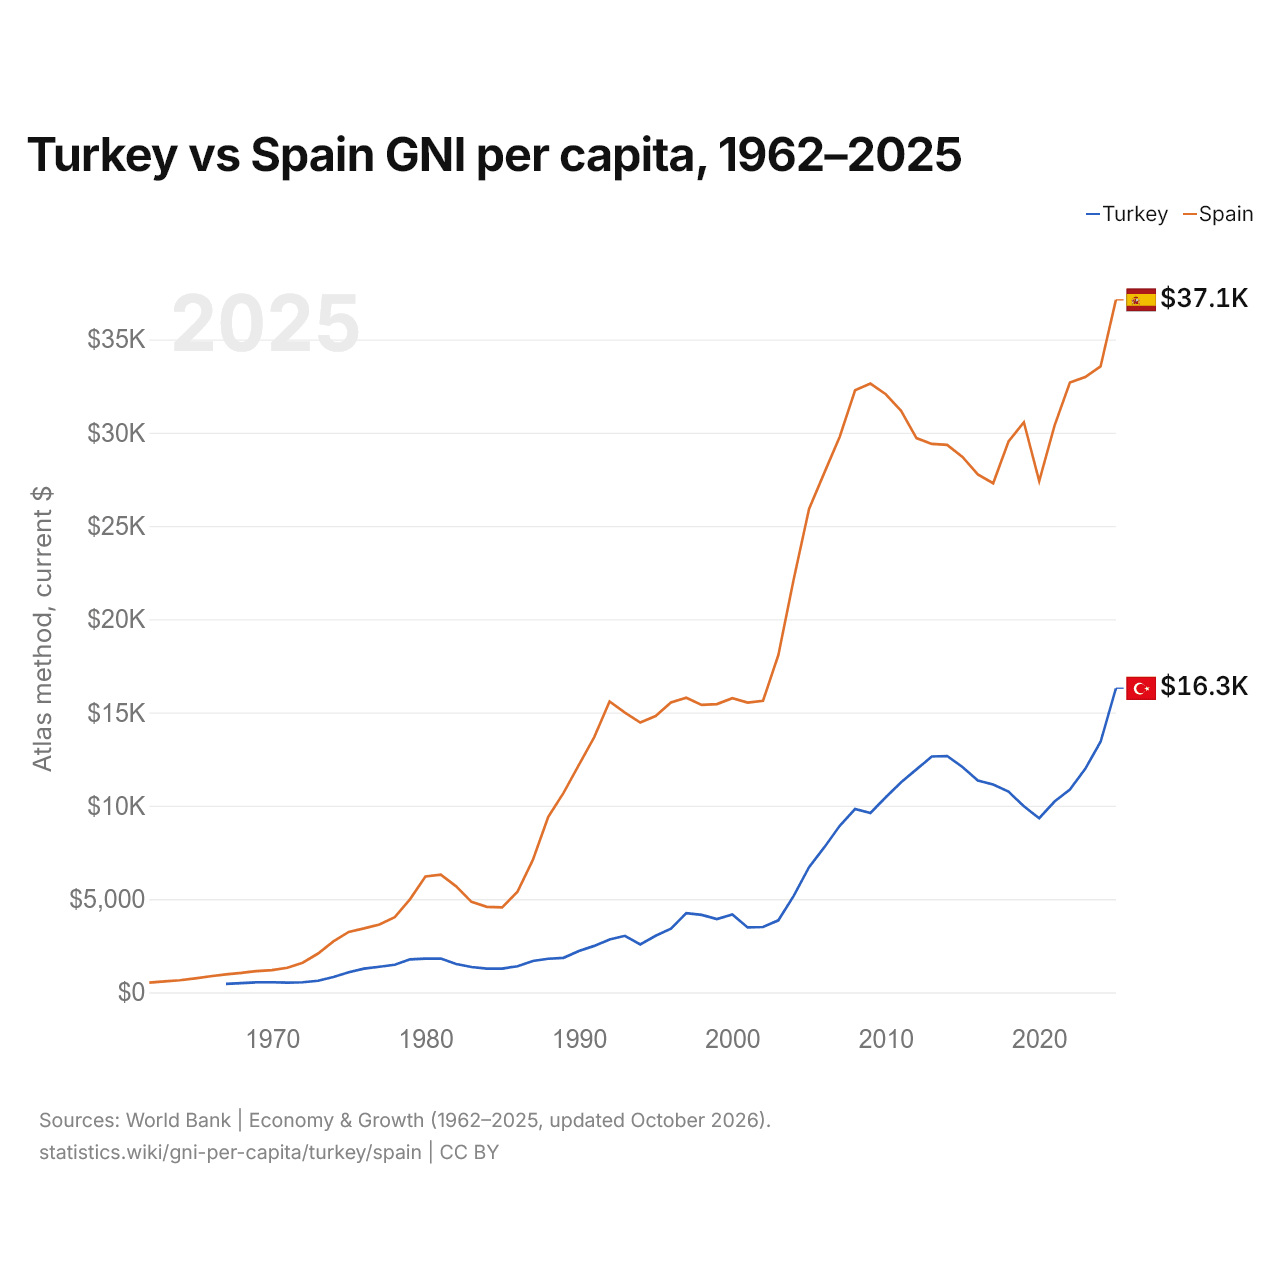
| Année | Méthode Atlas, dollars US courants | |
|---|---|---|
 Turquie |
 Espagne |
|
| 2025 | 16 300 $ US | 37 120 $ US |
| 2024 | 13 430 $ US | 33 550 $ US |
| 2023 | 11 980 $ US | 32 980 $ US |
| 2022 | 10 870 $ US | 32 690 $ US |
| 2021 | 10 230 $ US | 30 380 $ US |
| 2020 | 9 330 $ US | 27 410 $ US |
| 2019 | 9 970 $ US | 30 560 $ US |
| 2018 | 10 760 $ US | 29 530 $ US |
| 2017 | 11 140 $ US | 27 290 $ US |
| 2016 | 11 350 $ US | 27 760 $ US |
| 2015 | 12 080 $ US | 28 700 $ US |
| 2014 | 12 670 $ US | 29 350 $ US |
| 2013 | 12 640 $ US | 29 400 $ US |
| 2012 | 11 950 $ US | 29 710 $ US |
| 2011 | 11 260 $ US | 31 170 $ US |
| 2010 | 10 460 $ US | 32 060 $ US |
| 2009 | 9 610 $ US | 32 630 $ US |
| 2008 | 9 830 $ US | 32 270 $ US |
| 2007 | 8 930 $ US | 29 780 $ US |
| 2006 | 7 780 $ US | 27 860 $ US |
| 2005 | 6 710 $ US | 25 910 $ US |
| 2004 | 5 170 $ US | 22 140 $ US |
| 2003 | 3 860 $ US | 18 080 $ US |
| 2002 | 3 500 $ US | 15 630 $ US |
| 2001 | 3 480 $ US | 15 530 $ US |
| 2000 | 4 180 $ US | 15 770 $ US |
| 1999 | 3 930 $ US | 15 450 $ US |
| 1998 | 4 150 $ US | 15 410 $ US |
| 1997 | 4 250 $ US | 15 790 $ US |
| 1996 | 3 410 $ US | 15 540 $ US |
| 1995 | 3 030 $ US | 14 810 $ US |
| 1994 | 2 570 $ US | 14 460 $ US |
| 1993 | 3 030 $ US | 15 000 $ US |
| 1992 | 2 830 $ US | 15 590 $ US |
| 1991 | 2 490 $ US | 13 680 $ US |
| 1990 | 2 220 $ US | 12 190 $ US |
| 1989 | 1 850 $ US | 10 690 $ US |
| 1988 | 1 800 $ US | 9 400 $ US |
| 1987 | 1 680 $ US | 7 100 $ US |
| 1986 | 1 400 $ US | 5 400 $ US |
| 1985 | 1 270 $ US | 4 550 $ US |
| 1984 | 1 270 $ US | 4 580 $ US |
| 1983 | 1 360 $ US | 4 850 $ US |
| 1982 | 1 520 $ US | 5 680 $ US |
| 1981 | 1 810 $ US | 6 310 $ US |
| 1980 | 1 810 $ US | 6 210 $ US |
| 1979 | 1 770 $ US | 5 000 $ US |
| 1978 | 1 480 $ US | 4 030 $ US |
| 1977 | 1 370 $ US | 3 640 $ US |
| 1976 | 1 270 $ US | 3 430 $ US |
| 1975 | 1 080 $ US | 3 240 $ US |
| 1974 | 820 $ US | 2 730 $ US |
| 1973 | 620 $ US | 2 080 $ US |
| 1972 | 540 $ US | 1 590 $ US |
| 1971 | 520 $ US | 1 320 $ US |
| 1970 | 540 $ US | 1 190 $ US |
| 1969 | 540 $ US | 1 140 $ US |
| 1968 | 490 $ US | 1 040 $ US |
| 1967 | 450 $ US | 960 $ US |
| 1966 | - | 860 $ US |
| 1965 | - | 750 $ US |
| 1964 | - | 650 $ US |
| 1963 | - | 590 $ US |
| 1962 | - | 520 $ US |
En 2025, le RNB par habitant selon la méthode Atlas était de 16 300 $ US en Turquie et de 37 120 $ US en Espagne : 2,3 fois plus élevé en Espagne. En 1967, il était de 450 $ US en Turquie et de 960 $ US en Espagne, soit 2,1 fois plus en Espagne.
Le RNB par habitant de l'Espagne est plus élevé que celui de la Turquie chaque année depuis 1967. Converti selon la parité de pouvoir d'achat, le RNB par habitant était de 44 630 dollars en Turquie et de 59 830 dollars en Espagne en 2025 : 34 % de plus en Espagne.
Turquie vs Espagne : derniers chiffres du RNB par habitant
|
Turquie
|
Espagne
|
|
|---|---|---|
| Méthode Atlas, dollars US courants | 16 300 $US | 37 120 $US |
| Rang mondial | 66/194 | 33/194 |
| PPA, dollars internationaux | 44 630 $US | 59 830 $US |
| Groupe de revenu | Revenu intermédiaire supérieur | Revenu élevé |
| Écart de RNB par habitant | 0,44× | 2,3× |
Comparer le RNB par habitant de 2 pays au choix
Sources :
- Banque mondiale | Économie et croissance (1962–2025, mis à jour en octobre 2026)
Creative Commons Attribution (CC BY) : vous pouvez copier, partager, adapter et réutiliser ce contenu, y compris à des fins commerciales, à condition de citer statistics.wiki et d’indiquer les modifications apportées. Les sources citées ci-dessus peuvent avoir leurs propres conditions de licence.