
Venezuela vs Portugal : PIB, 1960–2025
| Année | PIB, dollars US courants | |
|---|---|---|
 Venezuela |
 Portugal |
|
| 2025 | 99 661 244 156 $ US | 346 639 825 142 $ US |
| 2024 | 120 566 112 397 $ US | 313 656 884 871 $ US |
| 2023 | 102 377 501 186 $ US | 292 323 800 949 $ US |
| 2022 | 89 013 251 021 $ US | 256 898 677 175 $ US |
| 2021 | 56 615 026 263 $ US | 256 055 879 091 $ US |
| 2020 | 42 837 965 907 $ US | 229 618 773 423 $ US |
| 2019 | 73 014 157 108 $ US | 240 115 970 063 $ US |
| 2018 | 101 987 075 929 $ US | 242 092 894 543 $ US |
| 2017 | 115 892 475 743 $ US | 220 862 990 767 $ US |
| 2016 | 112 948 035 495 $ US | 206 305 431 242 $ US |
| 2015 | 125 249 941 854 $ US | 199 038 523 120 $ US |
| 2014 | 214 838 755 022 $ US | 230 078 616 300 $ US |
| 2013 | 258 512 396 298 $ US | 226 677 408 292 $ US |
| 2012 | 371 846 610 182 $ US | 216 536 676 772 $ US |
| 2011 | 316 482 190 800 $ US | 245 426 767 676 $ US |
| 2010 | 393 192 354 511 $ US | 238 443 864 993 $ US |
| 2009 | 329 787 628 928 $ US | 244 667 762 836 $ US |
| 2008 | 315 953 388 511 $ US | 263 416 394 624 $ US |
| 2007 | 230 364 012 576 $ US | 240 496 147 317 $ US |
| 2006 | 183 477 522 124 $ US | 208 756 449 276 $ US |
| 2005 | 145 513 489 652 $ US | 197 253 876 705 $ US |
| 2004 | 112 451 400 425 $ US | 189 382 122 532 $ US |
| 2003 | 83 620 628 582 $ US | 165 226 175 537 $ US |
| 2002 | 92 893 587 734 $ US | 134 795 565 549 $ US |
| 2001 | 122 911 036 747 $ US | 121 604 107 165 $ US |
| 2000 | 117 146 466 003 $ US | 118 605 192 877 $ US |
| 1999 | 97 972 842 462 $ US | 127 470 385 557 $ US |
| 1998 | 91 336 763 255 $ US | 123 946 327 916 $ US |
| 1997 | 85 837 678 560 $ US | 117 016 535 163 $ US |
| 1996 | 70 543 211 119 $ US | 122 630 089 680 $ US |
| 1995 | 77 389 487 770 $ US | 118 122 007 430 $ US |
| 1994 | 58 418 666 667 $ US | 99 688 641 304 $ US |
| 1993 | 60 037 460 783 $ US | 95 009 751 901 $ US |
| 1992 | 60 416 519 620 $ US | 107 592 098 307 $ US |
| 1991 | 53 453 444 787 $ US | 89 233 599 278 $ US |
| 1990 | 48 606 952 195 $ US | 78 713 860 217 $ US |
| 1989 | 43 536 709 104 $ US | 60 594 092 182 $ US |
| 1988 | 60 226 413 793 $ US | 56 347 250 696 $ US |
| 1987 | 48 029 034 483 $ US | 48 182 925 857 $ US |
| 1986 | 60 516 123 711 $ US | 38 745 901 354 $ US |
| 1985 | 61 965 466 667 $ US | 27 115 807 742 $ US |
| 1984 | 59 867 743 468 $ US | 25 217 969 050 $ US |
| 1983 | 67 556 279 070 $ US | 27 239 650 742 $ US |
| 1982 | 67 736 744 186 $ US | 30 527 754 793 $ US |
| 1981 | 66 327 441 860 $ US | 31 977 276 873 $ US |
| 1980 | 59 116 511 628 $ US | 32 896 519 824 $ US |
| 1979 | 48 310 930 233 $ US | 26 622 819 672 $ US |
| 1978 | 39 316 279 070 $ US | 23 487 614 051 $ US |
| 1977 | 36 210 697 674 $ US | 21 439 523 311 $ US |
| 1976 | 31 419 534 884 $ US | 20 332 831 565 $ US |
| 1975 | 27 464 651 163 $ US | 19 347 607 843 $ US |
| 1974 | 26 100 930 233 $ US | 17 512 391 476 $ US |
| 1973 | 17 035 581 395 $ US | 15 090 564 186 $ US |
| 1972 | 13 977 727 273 $ US | 11 239 117 865 $ US |
| 1971 | 12 986 590 909 $ US | 9 201 604 240 $ US |
| 1970 | 11 561 111 111 $ US | 8 108 235 704 $ US |
| 1969 | 10 285 111 111 $ US | 7 287 555 035 $ US |
| 1968 | 10 034 444 444 $ US | 6 644 693 214 $ US |
| 1967 | 9 250 000 000 $ US | 6 002 607 030 $ US |
| 1966 | 8 781 333 333 $ US | 5 370 108 031 $ US |
| 1965 | 8 427 777 778 $ US | 4 901 711 248 $ US |
| 1964 | 8 192 413 793 $ US | 4 429 202 657 $ US |
| 1963 | 9 608 717 288 $ US | 4 084 251 593 $ US |
| 1962 | 8 814 309 884 $ US | 3 835 883 663 $ US |
| 1961 | 8 067 267 031 $ US | 3 573 719 085 $ US |
| 1960 | 7 663 938 303 $ US | 3 339 150 158 $ US |
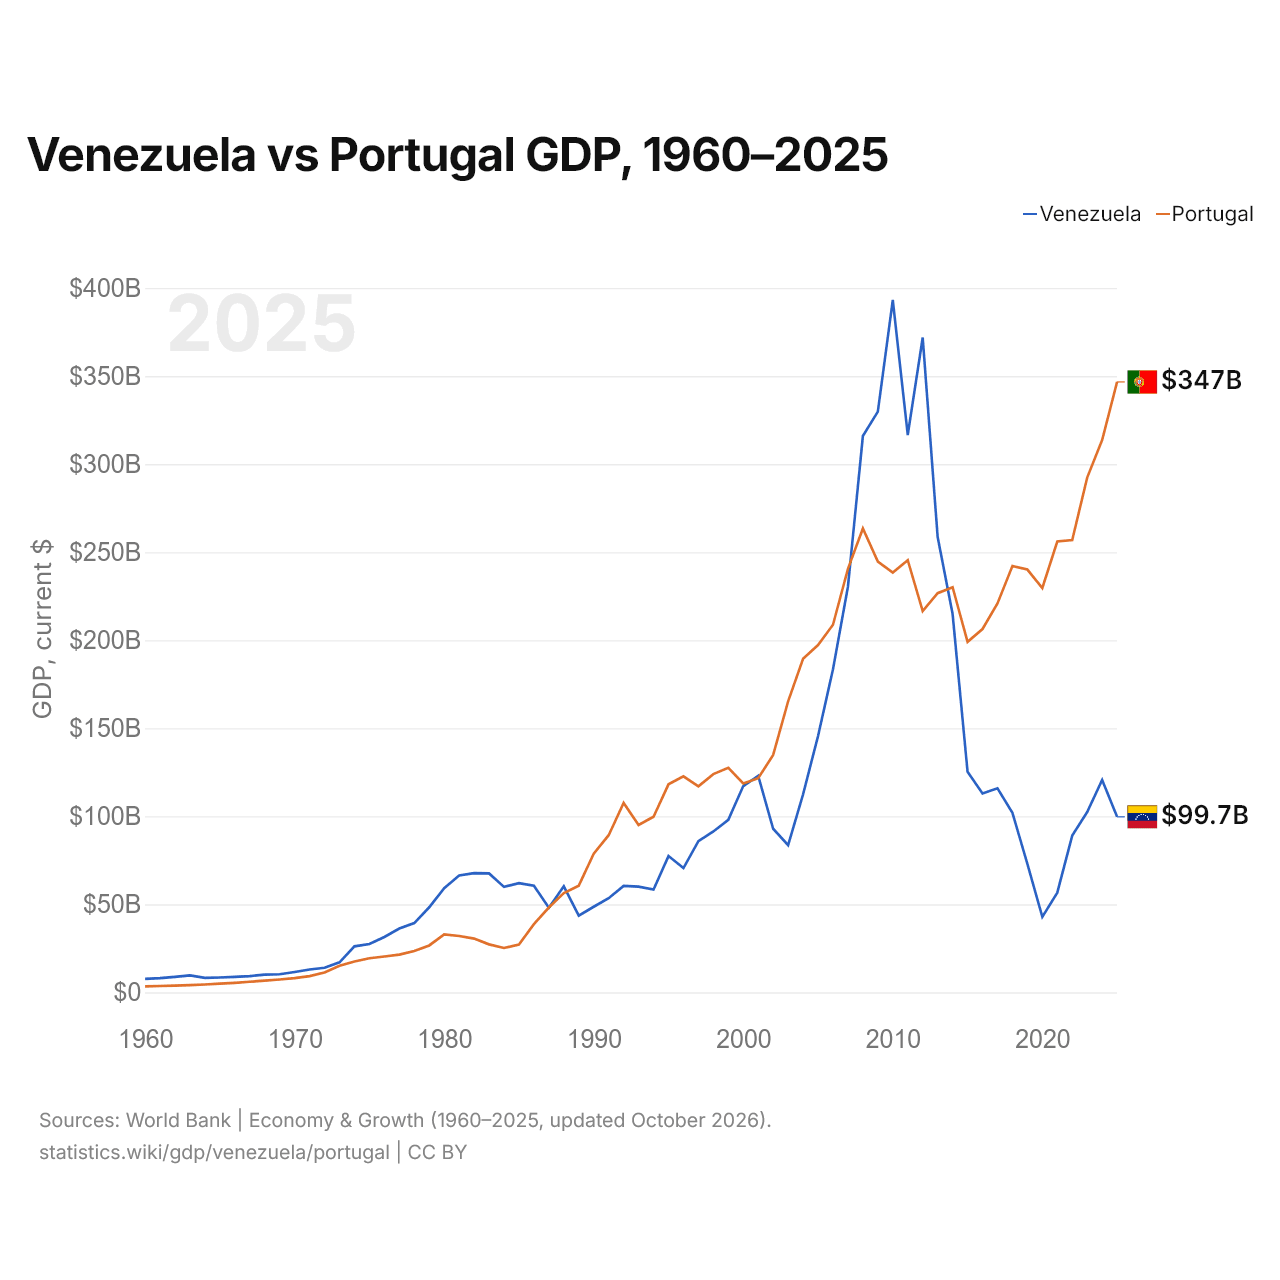
En 2025, le PIB du Portugal (347 milliards de dollars US) était 3,5 fois celui du Venezuela (99,7 milliards de dollars US). En 2015, le rapport était de 1,6. De 2015 à 2025, à prix constants de 2015, le PIB du Portugal a progressé de 24,0 %, tandis que celui du Venezuela a reculé de 65,4 %.
Depuis 2014, le PIB du Portugal est le plus élevé des deux ; en 1960, celui du Venezuela était 2,3 fois celui du Portugal. En 2025, le PIB par habitant était de 3 495 $ US au Venezuela et de 32 082 $ US au Portugal, soit 9,2 fois plus élevé au Portugal. En parité de pouvoir d'achat, l'ordre s'inverse : le PIB (PPA) est de 621 milliards de dollars au Venezuela (2011) et de 574 milliards de dollars au Portugal (2025).
Venezuela vs Portugal : derniers chiffres du PIB
|
Venezuela
|
Portugal
|
|
|---|---|---|
| PIB, dollars US courants | 99,7 Md $US | 347 Md $US |
| Rang mondial | 78/197 | 46/197 |
| Part mondiale | 0,08 % | 0,29 % |
| PIB, dollars US constants de 2015 | 43,3 Md $US | 247 Md $US |
| Écart de PIB | 0,29× | 3,5× |
Comparer le PIB de 2 pays au choix
Sources :
- Banque mondiale | Économie et croissance (1960–2025, mis à jour en octobre 2026)
Creative Commons Attribution (CC BY) : vous pouvez copier, partager, adapter et réutiliser ce contenu, y compris à des fins commerciales, à condition de citer statistics.wiki et d’indiquer les modifications apportées. Les sources citées ci-dessus peuvent avoir leurs propres conditions de licence.