
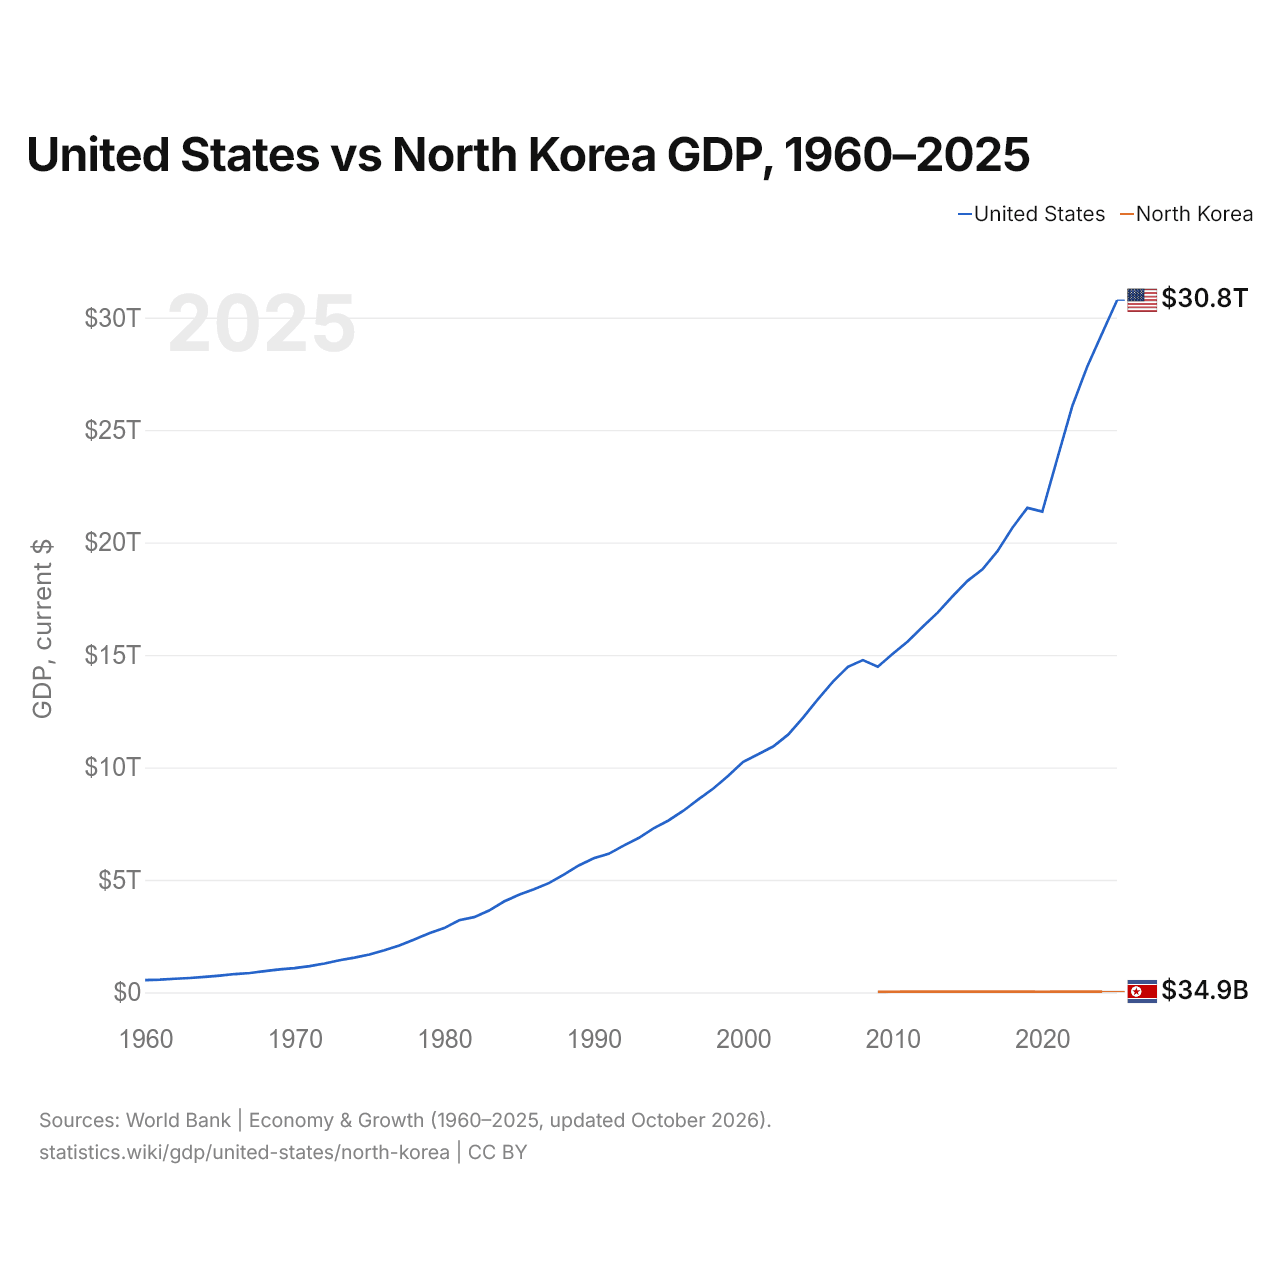
États-Unis vs Corée du Nord : PIB, 1960–2025
1x
| Année | PIB, dollars US courants | |
|---|---|---|
 États-Unis |
 Corée du Nord |
|
| 2025 | 30 769 700 000 000 $ US | - |
| 2024 | 29 298 013 000 000 $ US | 34 943 120 000 $ US |
| 2023 | 27 811 517 000 000 $ US | 32 155 360 000 $ US |
| 2022 | 26 054 614 000 000 $ US | 28 971 360 000 $ US |
| 2021 | 23 725 645 000 000 $ US | 32 301 720 000 $ US |
| 2020 | 21 375 281 000 000 $ US | 27 728 240 000 $ US |
| 2019 | 21 539 982 000 000 $ US | 28 222 880 000 $ US |
| 2018 | 20 656 516 000 000 $ US | 28 536 400 000 $ US |
| 2017 | 19 612 102 000 000 $ US | 29 105 440 000 $ US |
| 2016 | 18 804 913 000 000 $ US | 28 882 640 000 $ US |
| 2015 | 18 295 019 000 000 $ US | 30 723 030 000 $ US |
| 2014 | 17 608 138 000 000 $ US | 30 554 460 000 $ US |
| 2013 | 16 880 683 000 000 $ US | 30 588 922 000 $ US |
| 2012 | 16 253 970 000 000 $ US | 29 890 710 000 $ US |
| 2011 | 15 599 732 000 000 $ US | 29 005 020 000 $ US |
| 2010 | 15 048 971 000 000 $ US | 25 995 513 000 $ US |
| 2009 | 14 478 067 000 000 $ US | 23 356 470 000 $ US |
| 2008 | 14 769 862 000 000 $ US | - |
| 2007 | 14 474 228 000 000 $ US | - |
| 2006 | 13 815 583 000 000 $ US | - |
| 2005 | 13 039 197 000 000 $ US | - |
| 2004 | 12 217 196 000 000 $ US | - |
| 2003 | 11 456 450 000 000 $ US | - |
| 2002 | 10 929 108 000 000 $ US | - |
| 2001 | 10 581 929 000 000 $ US | - |
| 2000 | 10 250 952 000 000 $ US | - |
| 1999 | 9 631 172 000 000 $ US | - |
| 1998 | 9 062 817 000 000 $ US | - |
| 1997 | 8 577 552 000 000 $ US | - |
| 1996 | 8 073 122 000 000 $ US | - |
| 1995 | 7 639 749 000 000 $ US | - |
| 1994 | 7 287 236 000 000 $ US | - |
| 1993 | 6 858 559 000 000 $ US | - |
| 1992 | 6 520 327 000 000 $ US | - |
| 1991 | 6 158 129 000 000 $ US | - |
| 1990 | 5 963 144 000 000 $ US | - |
| 1989 | 5 641 580 000 000 $ US | - |
| 1988 | 5 236 438 000 000 $ US | - |
| 1987 | 4 855 215 000 000 $ US | - |
| 1986 | 4 579 631 000 000 $ US | - |
| 1985 | 4 338 979 000 000 $ US | - |
| 1984 | 4 037 613 000 000 $ US | - |
| 1983 | 3 634 038 000 000 $ US | - |
| 1982 | 3 343 789 000 000 $ US | - |
| 1981 | 3 207 041 000 000 $ US | - |
| 1980 | 2 857 307 000 000 $ US | - |
| 1979 | 2 627 333 000 000 $ US | - |
| 1978 | 2 351 599 000 000 $ US | - |
| 1977 | 2 081 826 000 000 $ US | - |
| 1976 | 1 873 412 000 000 $ US | - |
| 1975 | 1 684 904 000 000 $ US | - |
| 1974 | 1 545 243 000 000 $ US | - |
| 1973 | 1 425 376 000 000 $ US | - |
| 1972 | 1 279 110 000 000 $ US | - |
| 1971 | 1 164 850 000 000 $ US | - |
| 1970 | 1 073 303 000 000 $ US | - |
| 1969 | 1 017 438 172 414 $ US | - |
| 1968 | 940 225 000 000 $ US | - |
| 1967 | 859 620 034 483 $ US | - |
| 1966 | 813 032 758 621 $ US | - |
| 1965 | 741 904 862 069 $ US | - |
| 1964 | 684 144 620 690 $ US | - |
| 1963 | 637 058 551 724 $ US | - |
| 1962 | 603 639 413 793 $ US | - |
| 1961 | 561 940 310 345 $ US | - |
| 1960 | 541 988 586 207 $ US | - |
Le PIB des États-Unis (29,3 billions de dollars US, 2024) était 840 fois celui de la Corée du Nord (34,9 milliards de dollars US, 2024). En 2014, le rapport était de 580.
Depuis 2009, le PIB des États-Unis a chaque année été le plus élevé des deux ; en 2009, il était 620 fois celui de la Corée du Nord. Le PIB par habitant est de 90 027 $ US aux États-Unis (2025) et de 1 319 $ US en Corée du Nord (2024).
États-Unis vs Corée du Nord : derniers chiffres du PIB
|
États-Unis
|
Corée du Nord
|
|
|---|---|---|
| PIB, dollars US courants | 30,8 Bn $US (2025) | 34,9 Md $US (2024) |
| Rang mondial | 1/197 | 109/197 |
| Part mondiale | 26 % | 0,03 % |
Comparer le PIB de 2 pays au choix
Sources :
- Banque mondiale | Économie et croissance (1960–2025, mis à jour en octobre 2026)
Creative Commons Attribution (CC BY) : vous pouvez copier, partager, adapter et réutiliser ce contenu, y compris à des fins commerciales, à condition de citer statistics.wiki et d’indiquer les modifications apportées. Les sources citées ci-dessus peuvent avoir leurs propres conditions de licence.