
Suriname vs Guyana : PIB, 1960–2025
| Année | PIB, dollars US courants | |
|---|---|---|
 Suriname |
 Guyana |
|
| 2025 | 4 523 657 797 $ US | 27 097 477 218 $ US |
| 2024 | 4 416 775 113 $ US | 24 662 714 628 $ US |
| 2023 | 3 472 693 412 $ US | 16 918 503 597 $ US |
| 2022 | 3 791 603 200 $ US | 14 718 388 489 $ US |
| 2021 | 3 107 923 198 $ US | 8 041 362 110 $ US |
| 2020 | 2 911 807 496 $ US | 5 471 256 595 $ US |
| 2019 | 4 016 040 575 $ US | 5 173 760 192 $ US |
| 2018 | 3 996 198 867 $ US | 4 787 636 998 $ US |
| 2017 | 3 591 679 431 $ US | 4 748 174 334 $ US |
| 2016 | 3 317 421 648 $ US | 4 482 697 337 $ US |
| 2015 | 5 126 237 646 $ US | 4 279 840 194 $ US |
| 2014 | 5 240 606 061 $ US | 4 127 660 152 $ US |
| 2013 | 5 145 757 576 $ US | 4 167 800 929 $ US |
| 2012 | 4 980 000 000 $ US | 4 063 088 536 $ US |
| 2011 | 4 422 276 622 $ US | 3 691 384 318 $ US |
| 2010 | 4 368 370 998 $ US | 3 432 912 517 $ US |
| 2009 | 3 875 409 836 $ US | 3 165 663 153 $ US |
| 2008 | 3 532 969 035 $ US | 3 025 187 433 $ US |
| 2007 | 2 936 612 022 $ US | 2 730 971 595 $ US |
| 2006 | 2 626 380 435 $ US | 2 379 817 991 $ US |
| 2005 | 1 793 410 397 $ US | 824 880 550 $ US |
| 2004 | 1 484 092 538 $ US | 787 814 379 $ US |
| 2003 | 1 274 190 311 $ US | 743 063 950 $ US |
| 2002 | 1 093 574 468 $ US | 726 131 435 $ US |
| 2001 | 834 279 358 $ US | 712 167 450 $ US |
| 2000 | 947 671 970 $ US | 712 667 897 $ US |
| 1999 | 886 290 698 $ US | 694 754 988 $ US |
| 1998 | 1 110 850 000 $ US | 717 530 683 $ US |
| 1997 | 926 422 500 $ US | 749 138 010 $ US |
| 1996 | 861 372 806 $ US | 705 406 001 $ US |
| 1995 | 691 590 498 $ US | 621 626 786 $ US |
| 1994 | 605 492 537 $ US | 545 278 380 $ US |
| 1993 | 428 764 706 $ US | 454 101 382 $ US |
| 1992 | 404 600 000 $ US | 373 573 141 $ US |
| 1991 | 448 100 000 $ US | 348 533 095 $ US |
| 1990 | 388 400 000 $ US | 396 582 263 $ US |
| 1989 | 542 600 000 $ US | 379 779 390 $ US |
| 1988 | 1 161 000 000 $ US | 413 799 990 $ US |
| 1987 | 980 000 000 $ US | 354 591 847 $ US |
| 1986 | 891 000 000 $ US | 504 651 140 $ US |
| 1985 | 873 000 000 $ US | 453 488 372 $ US |
| 1984 | 864 000 000 $ US | 437 631 605 $ US |
| 1983 | 883 500 000 $ US | 489 333 333 $ US |
| 1982 | 915 000 000 $ US | 482 000 000 $ US |
| 1981 | 889 000 000 $ US | 570 357 107 $ US |
| 1980 | 795 000 000 $ US | 603 200 000 $ US |
| 1979 | 782 500 000 $ US | 530 440 000 $ US |
| 1978 | 735 500 000 $ US | 507 080 000 $ US |
| 1977 | 641 500 000 $ US | 449 880 000 $ US |
| 1976 | 505 500 000 $ US | 454 440 000 $ US |
| 1975 | 465 500 000 $ US | 494 791 667 $ US |
| 1974 | 409 850 000 $ US | 433 954 545 $ US |
| 1973 | 339 450 000 $ US | 307 047 619 $ US |
| 1972 | 311 950 000 $ US | 285 380 952 $ US |
| 1971 | 301 000 000 $ US | 282 050 000 $ US |
| 1970 | 274 900 000 $ US | 267 800 000 $ US |
| 1969 | 259 650 000 $ US | 249 300 000 $ US |
| 1968 | 241 350 000 $ US | 229 750 000 $ US |
| 1967 | 220 700 000 $ US | 250 176 471 $ US |
| 1966 | 190 350 000 $ US | 228 705 882 $ US |
| 1965 | 154 150 000 $ US | 213 235 294 $ US |
| 1964 | 134 400 000 $ US | 194 774 513 $ US |
| 1963 | 125 950 000 $ US | 175 757 894 $ US |
| 1962 | 116 150 000 $ US | 194 949 513 $ US |
| 1961 | 107 700 000 $ US | 185 849 535 $ US |
| 1960 | 99 650 000 $ US | 170 216 241 $ US |
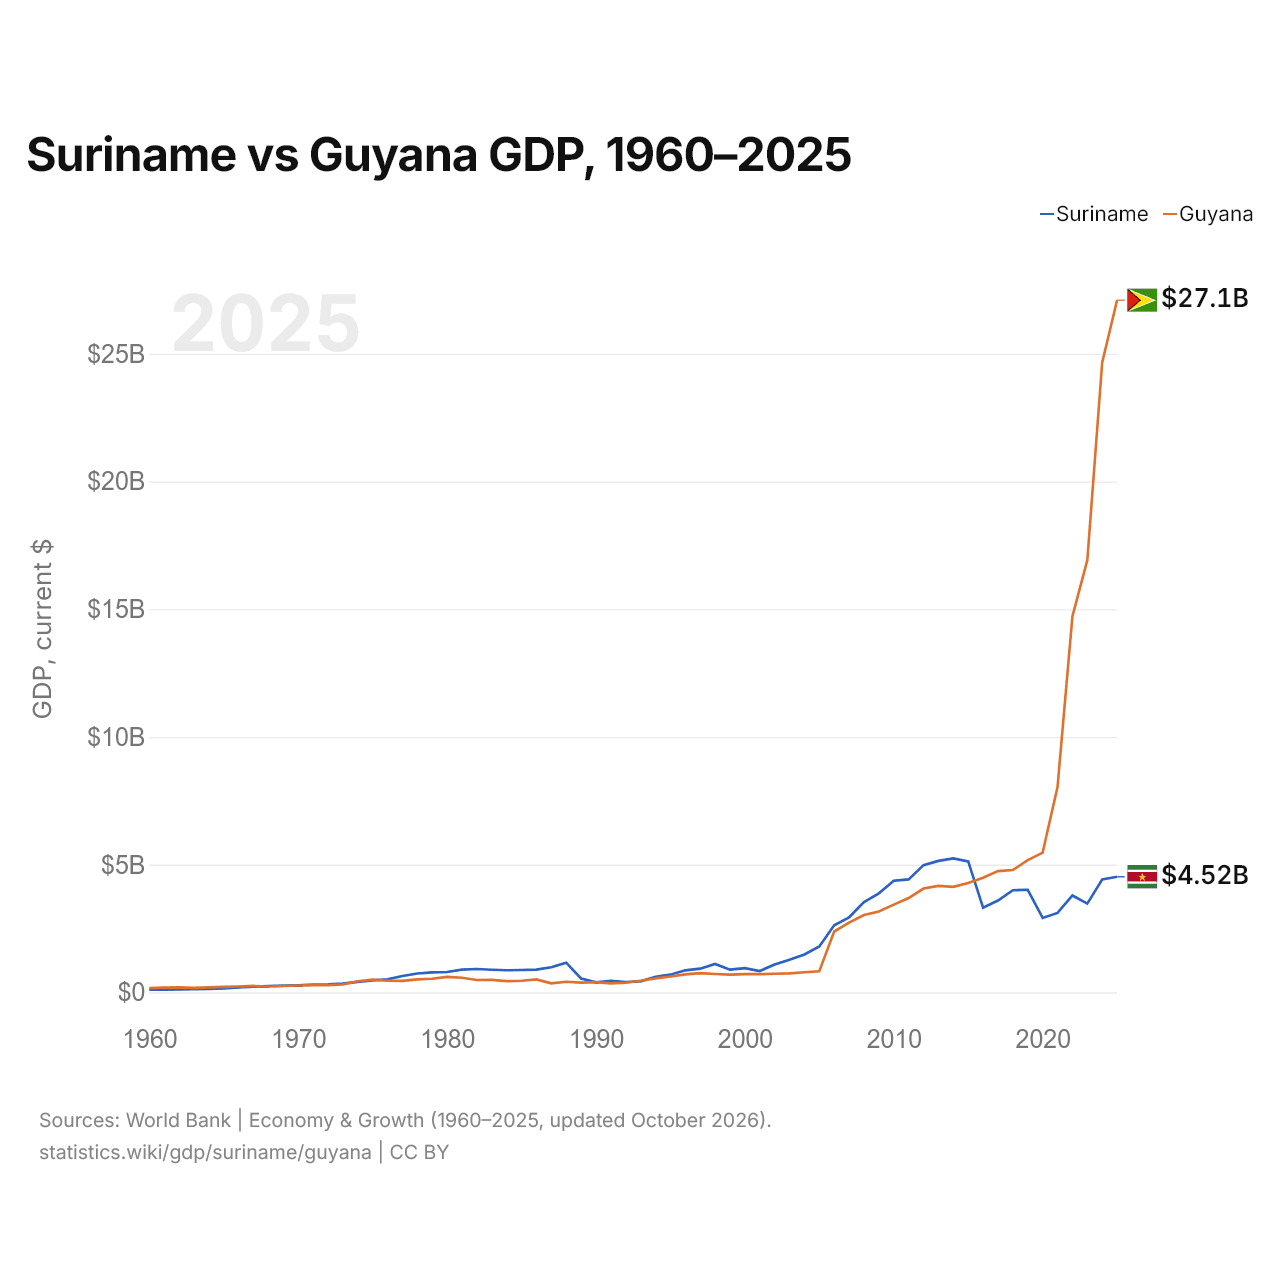
En 2025, le PIB du Guyana (27,1 milliards de dollars US) était 6,0 fois celui du Suriname (4,52 milliards de dollars US). En 2015, le plus élevé était celui du Suriname : supérieur de 20 % à celui du Guyana. De 2015 à 2025, à prix constants de 2015, le PIB du Guyana a progressé de 665,5 %, tandis que celui du Suriname a reculé de 8,7 %.
Depuis 2016, le PIB du Guyana est le plus élevé des deux ; il l'était aussi en 1960, 1,7 fois celui du Suriname. En 2025, le PIB par habitant était de 7 070 $ US au Suriname et de 32 414 $ US au Guyana, soit 4,6 fois plus élevé au Guyana.
Suriname vs Guyana : derniers chiffres du PIB
|
Suriname
|
Guyana
|
|
|---|---|---|
| PIB, dollars US courants | 4,52 Md $US | 27,1 Md $US |
| Rang mondial | 165/197 | 120/197 |
| Part mondiale | 0,004 % | 0,02 % |
| PIB, dollars US constants de 2015 | 4,68 Md $US | 32,8 Md $US |
| Écart de PIB | 0,17× | 6× |
Comparer le PIB de 2 pays au choix
Sources :
- Banque mondiale | Économie et croissance (1960–2025, mis à jour en octobre 2026)
Creative Commons Attribution (CC BY) : vous pouvez copier, partager, adapter et réutiliser ce contenu, y compris à des fins commerciales, à condition de citer statistics.wiki et d’indiquer les modifications apportées. Les sources citées ci-dessus peuvent avoir leurs propres conditions de licence.