
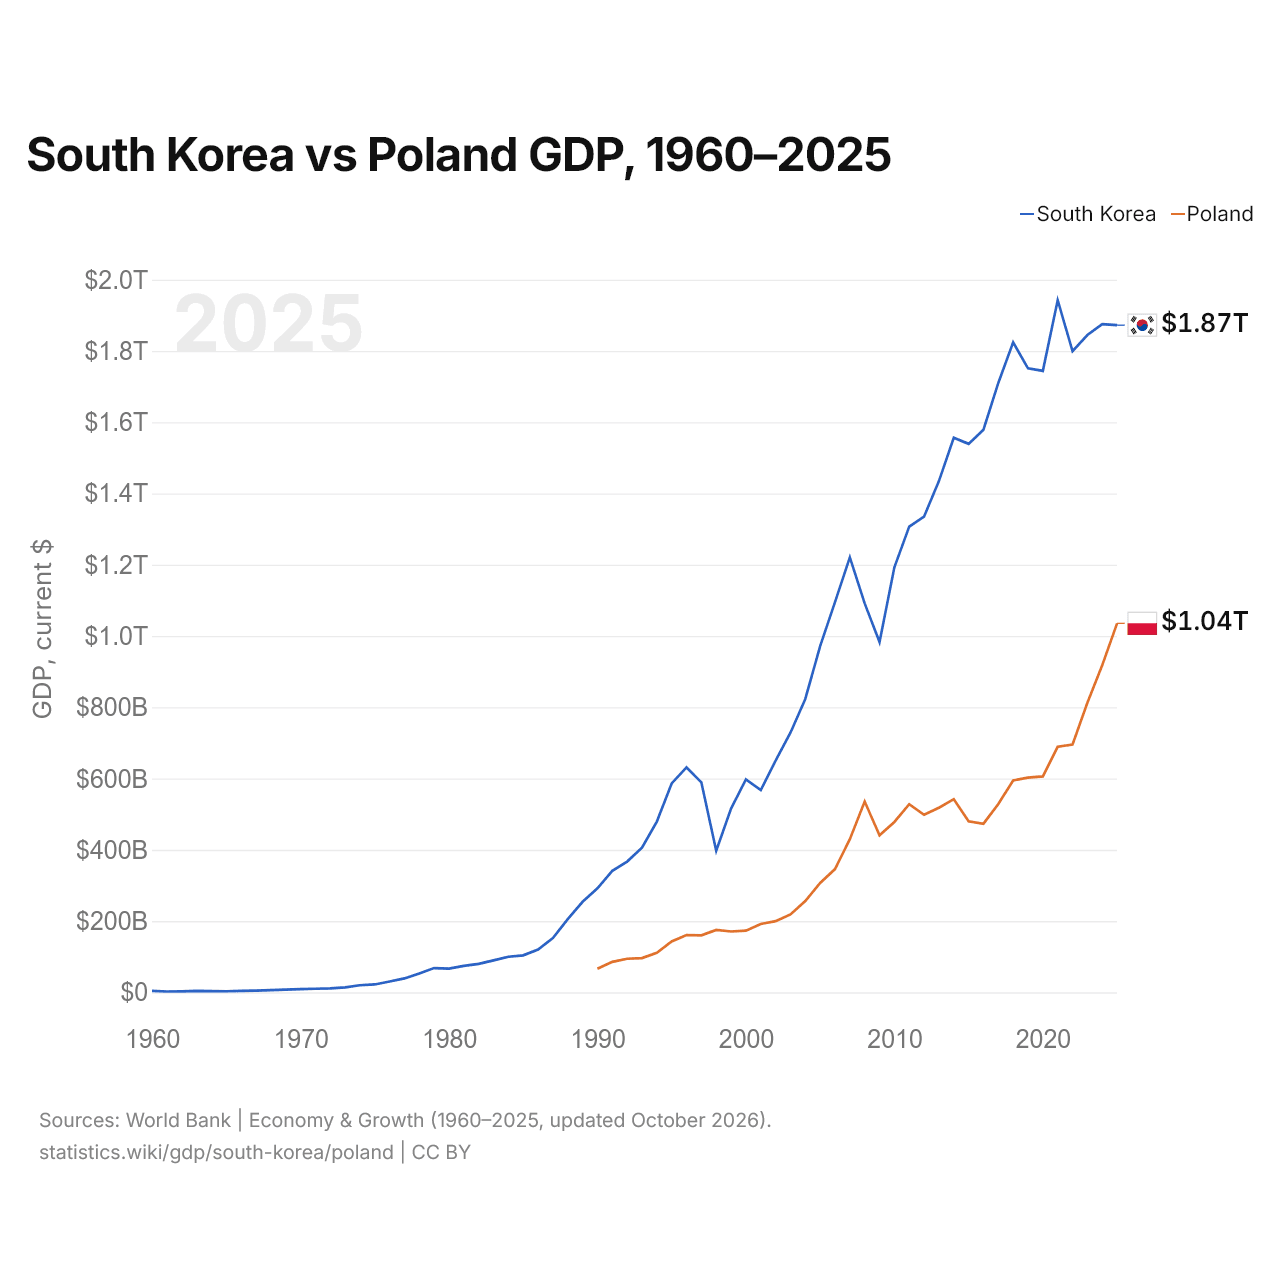
Corée du Sud vs Pologne : PIB, 1960–2025
| Année | PIB, dollars US courants | |
|---|---|---|
 Corée du Sud |
 Pologne |
|
| 2025 | 1 872 374 961 553 $ US | 1 035 491 784 197 $ US |
| 2024 | 1 875 388 209 407 $ US | 917 767 106 147 $ US |
| 2023 | 1 844 800 934 392 $ US | 812 451 193 396 $ US |
| 2022 | 1 799 363 116 867 $ US | 695 607 470 875 $ US |
| 2021 | 1 942 313 560 966 $ US | 689 170 230 665 $ US |
| 2020 | 1 744 070 276 373 $ US | 605 914 237 904 $ US |
| 2019 | 1 751 045 752 055 $ US | 602 683 770 145 $ US |
| 2018 | 1 824 251 454 307 $ US | 594 616 632 477 $ US |
| 2017 | 1 710 196 756 713 $ US | 528 356 723 263 $ US |
| 2016 | 1 579 150 518 945 $ US | 473 259 623 976 $ US |
| 2015 | 1 539 212 301 136 $ US | 480 054 118 583 $ US |
| 2014 | 1 556 252 422 020 $ US | 542 134 167 179 $ US |
| 2013 | 1 434 669 686 502 $ US | 518 179 836 405 $ US |
| 2012 | 1 335 343 586 438 $ US | 498 148 649 703 $ US |
| 2011 | 1 307 103 477 219 $ US | 527 848 543 023 $ US |
| 2010 | 1 192 830 015 738 $ US | 478 111 630 684 $ US |
| 2009 | 983 065 242 417 $ US | 440 891 472 247 $ US |
| 2008 | 1 091 580 692 542 $ US | 535 612 030 672 $ US |
| 2007 | 1 220 911 904 593 $ US | 429 715 132 138 $ US |
| 2006 | 1 095 175 538 508 $ US | 345 897 630 736 $ US |
| 2005 | 971 740 329 984 $ US | 306 999 913 151 $ US |
| 2004 | 823 251 107 639 $ US | 256 268 656 145 $ US |
| 2003 | 728 516 494 684 $ US | 218 561 225 998 $ US |
| 2002 | 650 014 391 470 $ US | 199 694 463 256 $ US |
| 2001 | 567 564 806 235 $ US | 191 823 200 371 $ US |
| 2000 | 597 487 173 479 $ US | 172 953 527 033 $ US |
| 1999 | 515 697 079 289 $ US | 170 704 452 715 $ US |
| 1998 | 397 297 216 492 $ US | 175 282 269 667 $ US |
| 1997 | 589 202 526 424 $ US | 159 893 964 917 $ US |
| 1996 | 631 196 863 758 $ US | 160 813 026 223 $ US |
| 1995 | 586 286 469 401 $ US | 142 838 527 115 $ US |
| 1994 | 479 181 794 217 $ US | 110 803 635 288 $ US |
| 1993 | 405 705 302 846 $ US | 96 043 157 273 $ US |
| 1992 | 366 921 291 825 $ US | 94 337 050 693 $ US |
| 1991 | 340 851 946 804 $ US | 85 500 935 935 $ US |
| 1990 | 292 064 221 389 $ US | 65 977 748 211 $ US |
| 1989 | 254 236 243 100 $ US | - |
| 1988 | 205 477 530 605 $ US | - |
| 1987 | 152 240 393 646 $ US | - |
| 1986 | 119 965 960 795 $ US | - |
| 1985 | 103 764 281 281 $ US | - |
| 1984 | 99 749 645 089 $ US | - |
| 1983 | 89 621 208 322 $ US | - |
| 1982 | 79 921 300 447 $ US | - |
| 1981 | 74 287 368 087 $ US | - |
| 1980 | 66 547 970 351 $ US | - |
| 1979 | 68 083 884 298 $ US | - |
| 1978 | 52 824 793 388 $ US | - |
| 1977 | 39 064 462 810 $ US | - |
| 1976 | 30 371 074 380 $ US | - |
| 1975 | 22 126 033 058 $ US | - |
| 1974 | 19 860 929 977 $ US | - |
| 1973 | 14 067 523 813 $ US | - |
| 1972 | 10 990 490 570 $ US | - |
| 1971 | 10 005 257 131 $ US | - |
| 1970 | 9 085 001 794 $ US | - |
| 1969 | 7 743 940 189 $ US | - |
| 1968 | 6 167 109 472 $ US | - |
| 1967 | 4 895 076 718 $ US | - |
| 1966 | 3 957 064 541 $ US | - |
| 1965 | 3 141 131 708 $ US | - |
| 1964 | 3 476 789 682 $ US | - |
| 1963 | 4 007 692 308 $ US | - |
| 1962 | 2 826 923 077 $ US | - |
| 1961 | 2 427 244 761 $ US | - |
| 1960 | 3 973 069 307 $ US | - |
En 2025, le PIB de la Corée du Sud (1,87 billion de dollars US) était 1,8 fois celui de la Pologne (1,04 billion de dollars US). En 2015, le rapport était de 3,2. De 2015 à 2025, à prix constants de 2015, le PIB de la Corée du Sud a progressé de 25,8 % et celui de la Pologne de 42,0 %.
Depuis 1990, le PIB de la Corée du Sud a chaque année été le plus élevé des deux ; en 1990, il était 4,4 fois celui de la Pologne. En 2025, le PIB par habitant était de 36 227 $ US en Corée du Sud et de 28 420 $ US en Pologne, soit 27 % de plus en Corée du Sud.
Corée du Sud vs Pologne : derniers chiffres du PIB
|
Corée du Sud
|
Pologne
|
|
|---|---|---|
| PIB, dollars US courants | 1,87 Bn $US | 1,04 Bn $US |
| Rang mondial | 13/197 | 21/197 |
| Part mondiale | 1,58 % | 0,87 % |
| PIB, dollars US constants de 2015 | 1,94 Bn $US | 682 Md $US |
| Écart de PIB | 1,8× | 0,55× |
Comparer le PIB de 2 pays au choix
Sources :
- Banque mondiale | Économie et croissance (1960–2025, mis à jour en octobre 2026)
Creative Commons Attribution (CC BY) : vous pouvez copier, partager, adapter et réutiliser ce contenu, y compris à des fins commerciales, à condition de citer statistics.wiki et d’indiquer les modifications apportées. Les sources citées ci-dessus peuvent avoir leurs propres conditions de licence.