
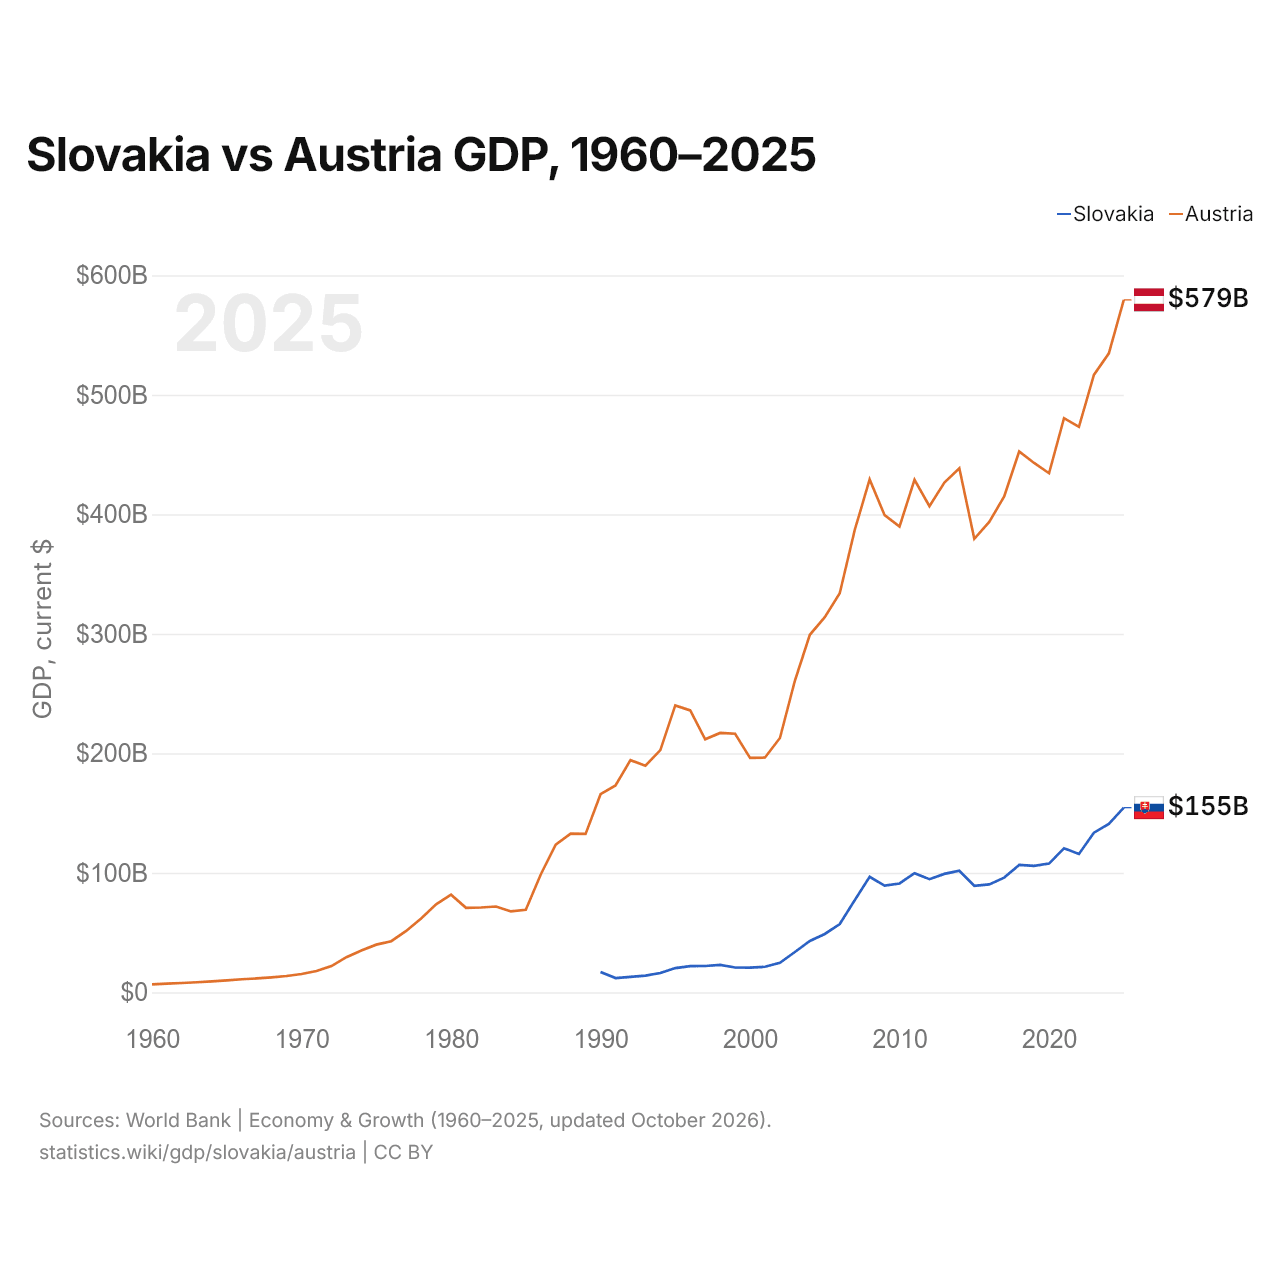
Slovaquie vs Autriche : PIB, 1960–2025
| Année | PIB, dollars US courants | |
|---|---|---|
 Slovaquie |
 Autriche |
|
| 2025 | 154 530 066 507 $ US | 579 470 021 095 $ US |
| 2024 | 140 934 076 532 $ US | 534 790 720 467 $ US |
| 2023 | 133 578 518 424 $ US | 516 670 509 629 $ US |
| 2022 | 115 792 972 358 $ US | 473 221 298 968 $ US |
| 2021 | 120 511 265 913 $ US | 480 466 363 177 $ US |
| 2020 | 107 732 602 896 $ US | 434 397 601 558 $ US |
| 2019 | 105 843 498 304 $ US | 442 983 642 372 $ US |
| 2018 | 106 611 673 365 $ US | 452 582 294 973 $ US |
| 2017 | 95 978 130 735 $ US | 414 926 138 133 $ US |
| 2016 | 90 347 173 229 $ US | 393 687 359 770 $ US |
| 2015 | 89 178 548 717 $ US | 379 546 097 301 $ US |
| 2014 | 101 713 075 599 $ US | 438 556 021 078 $ US |
| 2013 | 99 134 277 850 $ US | 426 580 502 769 $ US |
| 2012 | 94 724 394 278 $ US | 406 750 487 604 $ US |
| 2011 | 99 705 104 723 $ US | 428 954 737 064 $ US |
| 2010 | 91 112 160 801 $ US | 389 827 789 218 $ US |
| 2009 | 89 342 984 698 $ US | 399 290 118 782 $ US |
| 2008 | 96 685 492 864 $ US | 429 234 399 096 $ US |
| 2007 | 77 019 443 089 $ US | 386 760 177 589 $ US |
| 2006 | 57 111 148 619 $ US | 333 905 979 332 $ US |
| 2005 | 48 823 790 951 $ US | 313 952 317 331 $ US |
| 2004 | 42 960 730 480 $ US | 299 210 411 455 $ US |
| 2003 | 33 761 723 946 $ US | 260 779 834 340 $ US |
| 2002 | 24 768 142 566 $ US | 212 837 224 023 $ US |
| 2001 | 21 377 597 035 $ US | 196 477 206 829 $ US |
| 2000 | 20 626 538 612 $ US | 196 181 599 831 $ US |
| 1999 | 20 813 421 086 $ US | 216 421 809 126 $ US |
| 1998 | 22 911 708 405 $ US | 217 068 085 816 $ US |
| 1997 | 22 026 728 498 $ US | 211 724 812 267 $ US |
| 1996 | 21 864 845 214 $ US | 235 952 581 232 $ US |
| 1995 | 20 306 095 054 $ US | 240 094 169 510 $ US |
| 1994 | 16 187 735 322 $ US | 202 738 023 130 $ US |
| 1993 | 13 991 963 247 $ US | 189 634 029 339 $ US |
| 1992 | 12 932 972 789 $ US | 194 314 032 056 $ US |
| 1991 | 11 952 983 608 $ US | 173 113 449 617 $ US |
| 1990 | 17 068 924 602 $ US | 165 811 372 383 $ US |
| 1989 | - | 132 584 448 258 $ US |
| 1988 | - | 132 817 124 707 $ US |
| 1987 | - | 123 682 091 859 $ US |
| 1986 | - | 98 648 254 169 $ US |
| 1985 | - | 69 114 996 010 $ US |
| 1984 | - | 67 719 055 773 $ US |
| 1983 | - | 71 838 528 420 $ US |
| 1982 | - | 70 996 111 963 $ US |
| 1981 | - | 70 755 997 062 $ US |
| 1980 | - | 81 737 498 405 $ US |
| 1979 | - | 73 647 694 287 $ US |
| 1978 | - | 61 809 208 756 $ US |
| 1977 | - | 51 343 861 460 $ US |
| 1976 | - | 42 791 707 448 $ US |
| 1975 | - | 39 902 300 703 $ US |
| 1974 | - | 35 051 468 640 $ US |
| 1973 | - | 29 399 860 145 $ US |
| 1972 | - | 21 973 207 929 $ US |
| 1971 | - | 17 788 536 733 $ US |
| 1970 | - | 15 312 791 744 $ US |
| 1969 | - | 13 647 475 854 $ US |
| 1968 | - | 12 499 863 917 $ US |
| 1967 | - | 11 634 569 522 $ US |
| 1966 | - | 10 939 526 219 $ US |
| 1965 | - | 10 041 659 445 $ US |
| 1964 | - | 9 213 648 656 $ US |
| 1963 | - | 8 414 050 621 $ US |
| 1962 | - | 7 793 042 529 $ US |
| 1961 | - | 7 346 566 038 $ US |
| 1960 | - | 6 624 086 313 $ US |
En 2025, le PIB de l'Autriche (579 milliards de dollars US) était 3,7 fois celui de la Slovaquie (155 milliards de dollars US). En 2015, le rapport était de 4,3. De 2015 à 2025, à prix constants de 2015, le PIB de l'Autriche a progressé de 11,8 % et celui de la Slovaquie de 21,2 %.
Depuis 1990, le PIB de l'Autriche a chaque année été le plus élevé des deux ; en 1990, il était 9,7 fois celui de la Slovaquie. En 2025, le PIB par habitant était de 28 544 $ US en Slovaquie et de 62 930 $ US en Autriche, soit 2,2 fois plus élevé en Autriche.
Slovaquie vs Autriche : derniers chiffres du PIB
|
Slovaquie
|
Autriche
|
|
|---|---|---|
| PIB, dollars US courants | 155 Md $US | 579 Md $US |
| Rang mondial | 60/197 | 29/197 |
| Part mondiale | 0,13 % | 0,49 % |
| PIB, dollars US constants de 2015 | 108 Md $US | 424 Md $US |
| Écart de PIB | 0,27× | 3,7× |
Comparer le PIB de 2 pays au choix
Sources :
- Banque mondiale | Économie et croissance (1960–2025, mis à jour en octobre 2026)
Creative Commons Attribution (CC BY) : vous pouvez copier, partager, adapter et réutiliser ce contenu, y compris à des fins commerciales, à condition de citer statistics.wiki et d’indiquer les modifications apportées. Les sources citées ci-dessus peuvent avoir leurs propres conditions de licence.