
Roumanie vs Maroc : PIB, 1960–2025
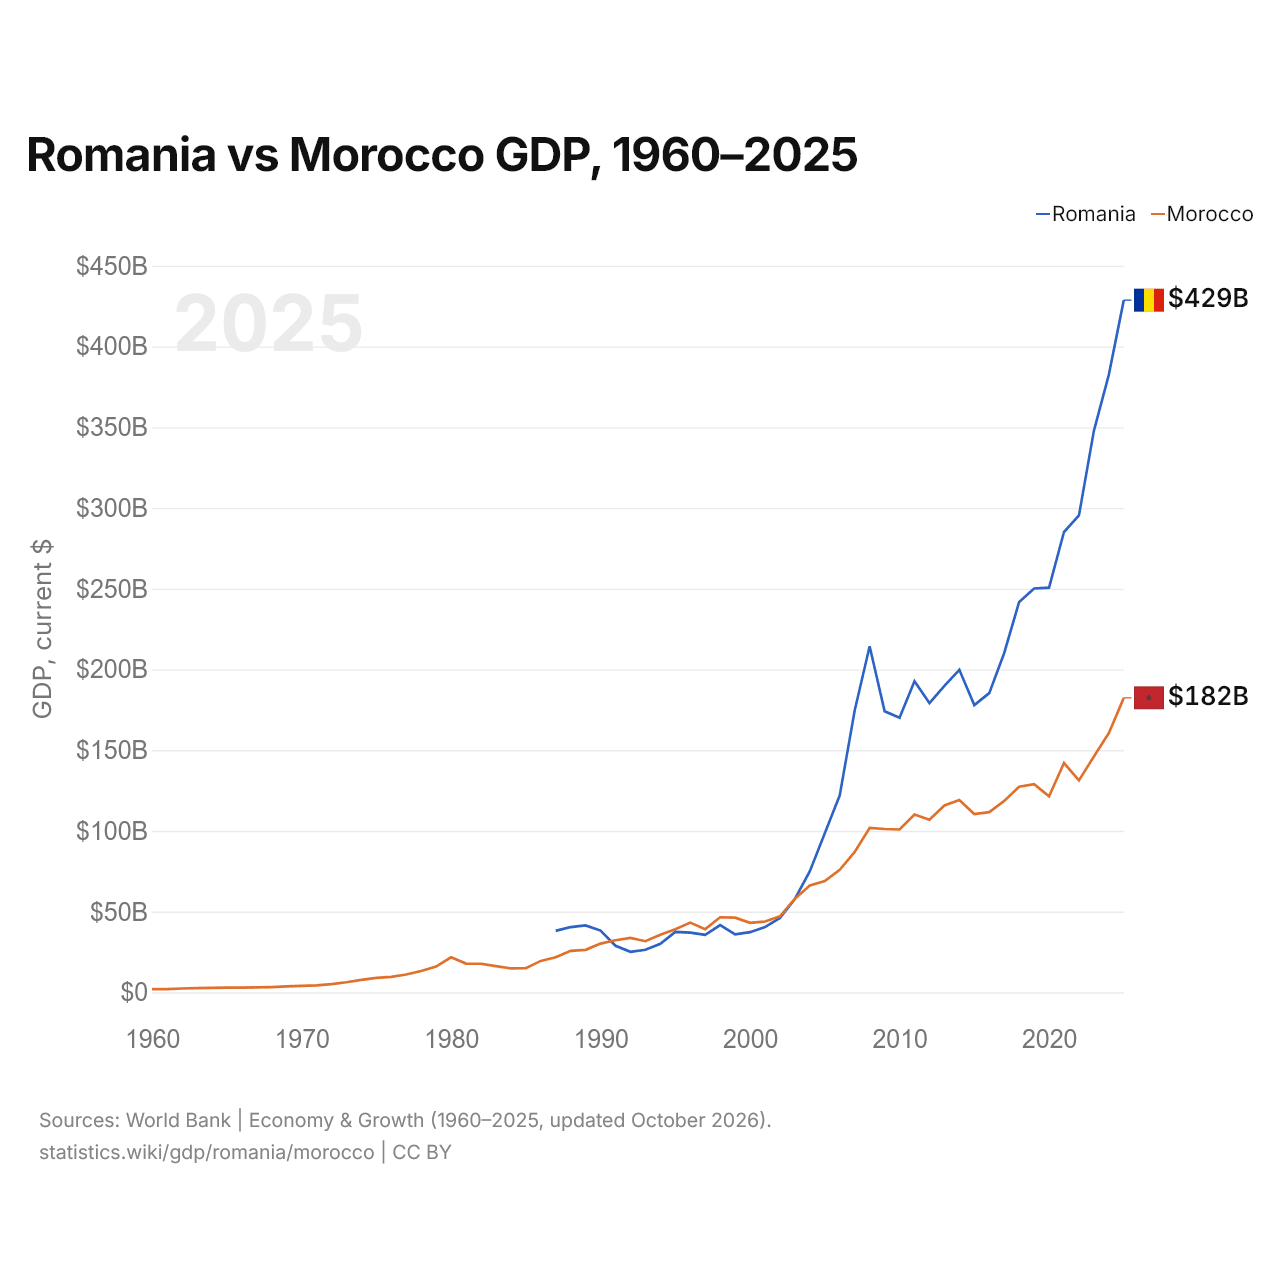
| Année | PIB, dollars US courants | |
|---|---|---|
 Roumanie |
 Maroc |
|
| 2025 | 428 677 977 855 $ US | 182 374 250 612 $ US |
| 2024 | 382 564 217 989 $ US | 160 610 994 055 $ US |
| 2023 | 347 757 995 759 $ US | 146 036 093 667 $ US |
| 2022 | 295 317 862 856 $ US | 131 245 312 804 $ US |
| 2021 | 285 072 444 957 $ US | 142 022 058 447 $ US |
| 2020 | 250 624 575 872 $ US | 121 353 645 057 $ US |
| 2019 | 250 080 428 512 $ US | 128 920 266 409 $ US |
| 2018 | 241 791 427 224 $ US | 127 341 147 582 $ US |
| 2017 | 210 147 385 855 $ US | 118 540 573 368 $ US |
| 2016 | 185 290 759 249 $ US | 111 572 947 005 $ US |
| 2015 | 177 885 131 240 $ US | 110 413 823 842 $ US |
| 2014 | 199 722 319 676 $ US | 119 130 841 412 $ US |
| 2013 | 189 798 603 751 $ US | 115 739 287 305 $ US |
| 2012 | 179 117 323 107 $ US | 106 937 392 311 $ US |
| 2011 | 192 623 977 894 $ US | 110 080 631 332 $ US |
| 2010 | 170 064 350 672 $ US | 100 865 329 473 $ US |
| 2009 | 174 110 532 659 $ US | 101 154 952 241 $ US |
| 2008 | 214 315 932 061 $ US | 101 822 906 949 $ US |
| 2007 | 174 588 782 939 $ US | 86 947 913 287 $ US |
| 2006 | 122 023 735 993 $ US | 75 883 823 301 $ US |
| 2005 | 98 454 380 120 $ US | 68 852 658 069 $ US |
| 2004 | 74 973 656 852 $ US | 66 114 145 451 $ US |
| 2003 | 57 806 384 143 $ US | 58 029 363 354 $ US |
| 2002 | 46 065 502 703 $ US | 47 077 192 188 $ US |
| 2001 | 40 395 116 581 $ US | 43 831 480 208 $ US |
| 2000 | 37 253 739 511 $ US | 43 017 455 402 $ US |
| 1999 | 35 953 156 754 $ US | 46 266 428 648 $ US |
| 1998 | 41 696 091 974 $ US | 46 497 608 725 $ US |
| 1997 | 35 575 214 078 $ US | 39 147 844 526 $ US |
| 1996 | 36 937 074 278 $ US | 43 161 571 528 $ US |
| 1995 | 37 430 162 103 $ US | 39 030 285 468 $ US |
| 1994 | 30 072 805 104 $ US | 35 604 137 423 $ US |
| 1993 | 26 361 160 450 $ US | 31 655 473 664 $ US |
| 1992 | 25 121 666 667 $ US | 33 711 069 431 $ US |
| 1991 | 28 850 634 900 $ US | 32 285 573 574 $ US |
| 1990 | 38 247 882 300 $ US | 30 179 954 775 $ US |
| 1989 | 41 450 777 202 $ US | 26 314 313 191 $ US |
| 1988 | 40 424 528 302 $ US | 25 705 296 184 $ US |
| 1987 | 38 067 567 568 $ US | 21 765 195 948 $ US |
| 1986 | - | 19 462 085 540 $ US |
| 1985 | - | 14 991 283 216 $ US |
| 1984 | - | 14 824 667 954 $ US |
| 1983 | - | 16 251 408 128 $ US |
| 1982 | - | 17 692 276 734 $ US |
| 1981 | - | 17 788 185 479 $ US |
| 1980 | - | 21 728 516 153 $ US |
| 1979 | - | 15 911 994 817 $ US |
| 1978 | - | 13 236 946 234 $ US |
| 1977 | - | 11 049 783 872 $ US |
| 1976 | - | 9 584 297 284 $ US |
| 1975 | - | 8 984 853 005 $ US |
| 1974 | - | 7 675 466 449 $ US |
| 1973 | - | 6 242 145 880 $ US |
| 1972 | - | 5 074 117 545 $ US |
| 1971 | - | 4 356 669 034 $ US |
| 1970 | - | 3 956 336 244 $ US |
| 1969 | - | 3 651 622 669 $ US |
| 1968 | - | 3 271 422 333 $ US |
| 1967 | - | 3 046 345 314 $ US |
| 1966 | - | 2 876 401 297 $ US |
| 1965 | - | 2 948 331 090 $ US |
| 1964 | - | 2 798 345 299 $ US |
| 1963 | - | 2 657 252 578 $ US |
| 1962 | - | 2 379 611 125 $ US |
| 1961 | - | 2 025 693 540 $ US |
| 1960 | - | 2 037 154 742 $ US |
En 2025, le PIB de la Roumanie (429 milliards de dollars US) était 2,4 fois celui du Maroc (182 milliards de dollars US). En 2015, le rapport était de 1,6. De 2015 à 2025, à prix constants de 2015, le PIB de la Roumanie a progressé de 34,4 % et celui du Maroc de 28,8 %.
Depuis 2004, le PIB de la Roumanie est le plus élevé des deux ; il l'était aussi en 1987, 1,7 fois celui du Maroc. En 2025, le PIB par habitant était de 22 538 $ US en Roumanie et de 4 746 $ US au Maroc, soit 4,7 fois plus élevé en Roumanie.
Roumanie vs Maroc : derniers chiffres du PIB
|
Roumanie
|
Maroc
|
|
|---|---|---|
| PIB, dollars US courants | 429 Md $US | 182 Md $US |
| Rang mondial | 39/197 | 58/197 |
| Part mondiale | 0,36 % | 0,15 % |
| PIB, dollars US constants de 2015 | 239 Md $US | 142 Md $US |
| Écart de PIB | 2,4× | 0,43× |
Comparer le PIB de 2 pays au choix
Sources :
- Banque mondiale | Économie et croissance (1960–2025, mis à jour en octobre 2026)
Creative Commons Attribution (CC BY) : vous pouvez copier, partager, adapter et réutiliser ce contenu, y compris à des fins commerciales, à condition de citer statistics.wiki et d’indiquer les modifications apportées. Les sources citées ci-dessus peuvent avoir leurs propres conditions de licence.