
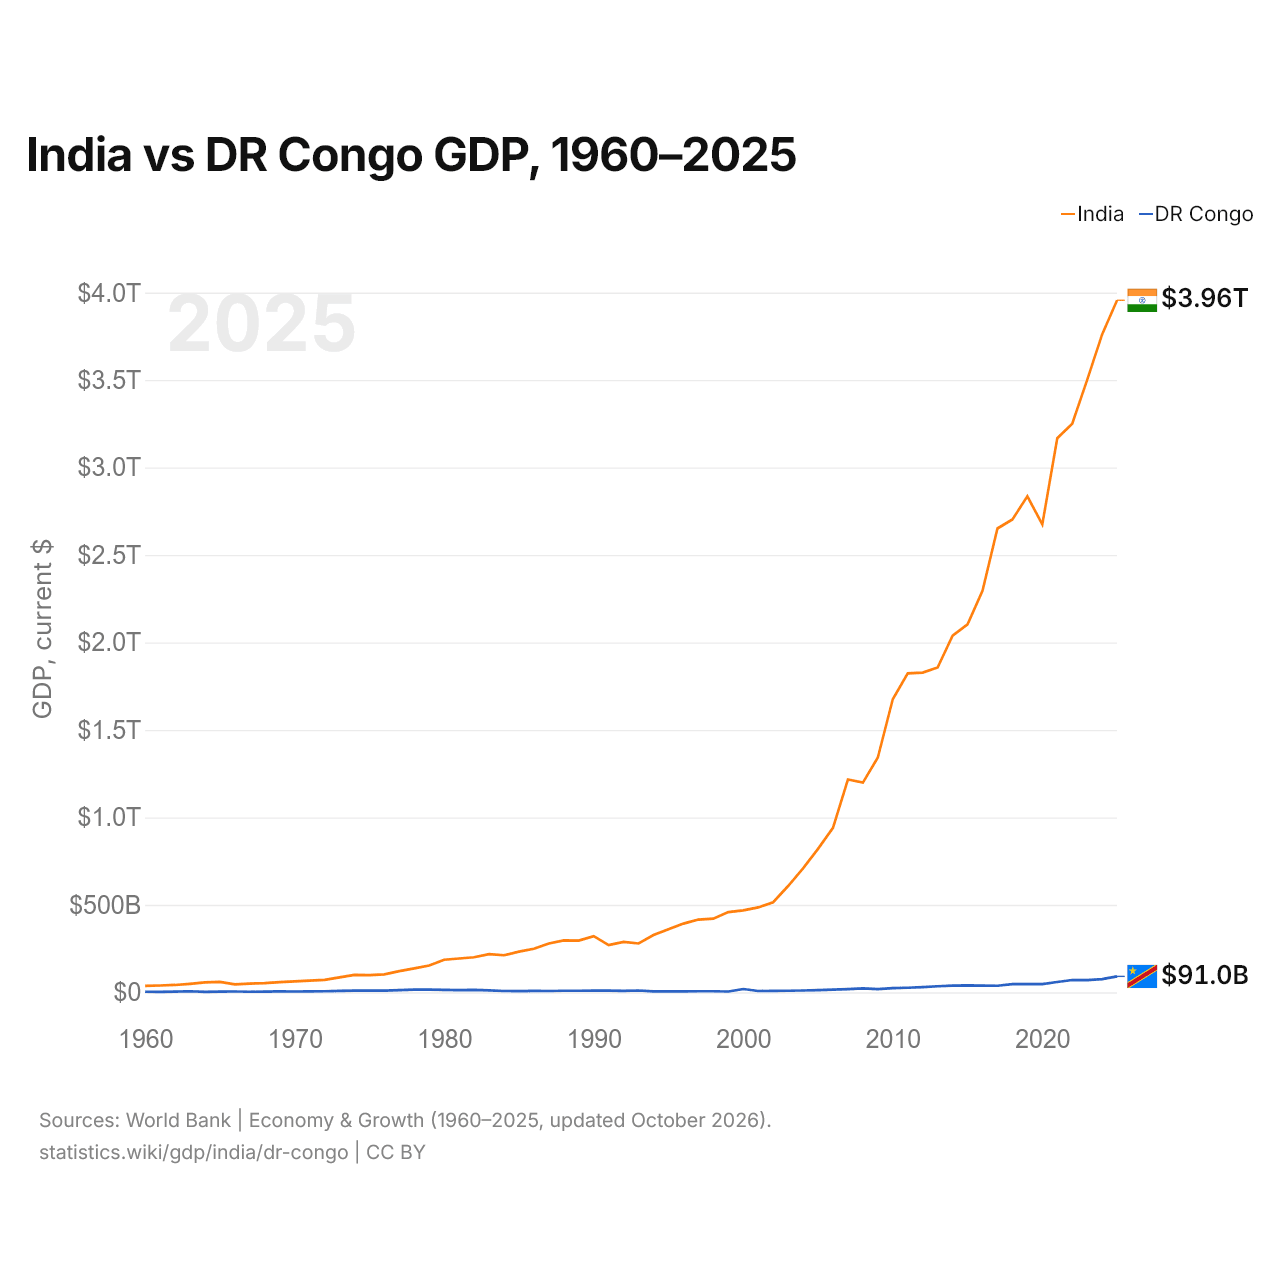
Inde vs République démocratique du Congo : PIB, 1960–2025
| Année | PIB, dollars US courants | |
|---|---|---|
 Inde |
 RDC |
|
| 2025 | 3 956 067 115 772 $ US | 91 030 531 317 $ US |
| 2024 | 3 760 813 470 501 $ US | 75 716 176 105 $ US |
| 2023 | 3 500 906 030 645 $ US | 69 843 655 425 $ US |
| 2022 | 3 249 938 492 013 $ US | 70 422 346 142 $ US |
| 2021 | 3 167 270 623 260 $ US | 59 067 289 574 $ US |
| 2020 | 2 674 851 578 587 $ US | 46 691 989 749 $ US |
| 2019 | 2 835 606 256 558 $ US | 46 845 900 350 $ US |
| 2018 | 2 702 929 641 649 $ US | 46 659 954 092 $ US |
| 2017 | 2 651 474 262 755 $ US | 37 537 521 566 $ US |
| 2016 | 2 294 796 885 663 $ US | 38 600 224 214 $ US |
| 2015 | 2 103 588 360 045 $ US | 40 179 574 490 $ US |
| 2014 | 2 039 126 479 155 $ US | 38 352 980 553 $ US |
| 2013 | 1 856 721 507 622 $ US | 34 891 189 160 $ US |
| 2012 | 1 827 637 590 410 $ US | 30 029 369 929 $ US |
| 2011 | 1 823 051 829 895 $ US | 26 392 379 642 $ US |
| 2010 | 1 675 615 519 485 $ US | 24 161 641 931 $ US |
| 2009 | 1 341 888 016 995 $ US | 18 607 259 481 $ US |
| 2008 | 1 198 895 139 006 $ US | 22 723 488 723 $ US |
| 2007 | 1 216 736 438 835 $ US | 18 374 807 773 $ US |
| 2006 | 940 259 888 788 $ US | 15 484 044 535 $ US |
| 2005 | 820 383 763 511 $ US | 12 609 728 573 $ US |
| 2004 | 709 152 728 831 $ US | 10 297 483 481 $ US |
| 2003 | 607 700 687 237 $ US | 8 937 567 060 $ US |
| 2002 | 514 939 140 319 $ US | 8 728 038 525 $ US |
| 2001 | 485 440 139 204 $ US | 7 438 189 100 $ US |
| 2000 | 468 395 521 654 $ US | 19 088 046 306 $ US |
| 1999 | 458 821 052 616 $ US | 4 711 259 427 $ US |
| 1998 | 421 351 317 225 $ US | 6 217 805 821 $ US |
| 1997 | 415 867 563 593 $ US | 6 090 838 693 $ US |
| 1996 | 392 896 866 205 $ US | 5 771 456 952 $ US |
| 1995 | 360 281 909 643 $ US | 5 643 439 376 $ US |
| 1994 | 327 274 843 459 $ US | 5 820 382 248 $ US |
| 1993 | 279 295 648 983 $ US | 10 706 259 937 $ US |
| 1992 | 288 208 070 278 $ US | 8 227 343 907 $ US |
| 1991 | 270 105 341 879 $ US | 9 625 436 873 $ US |
| 1990 | 320 979 026 420 $ US | 9 349 764 580 $ US |
| 1989 | 296 042 052 945 $ US | 9 021 862 775 $ US |
| 1988 | 296 589 670 896 $ US | 8 861 299 977 $ US |
| 1987 | 279 033 584 092 $ US | 7 661 625 473 $ US |
| 1986 | 248 985 994 041 $ US | 8 095 367 168 $ US |
| 1985 | 232 511 554 840 $ US | 7 195 042 616 $ US |
| 1984 | 212 157 645 178 $ US | 7 857 729 193 $ US |
| 1983 | 218 262 146 413 $ US | 11 006 712 650 $ US |
| 1982 | 200 715 624 831 $ US | 13 651 667 371 $ US |
| 1981 | 193 491 368 446 $ US | 12 537 821 038 $ US |
| 1980 | 186 328 579 302 $ US | 14 394 927 495 $ US |
| 1979 | 152 995 442 498 $ US | 15 068 422 236 $ US |
| 1978 | 137 302 319 829 $ US | 15 372 608 002 $ US |
| 1977 | 121 486 641 441 $ US | 12 344 424 764 $ US |
| 1976 | 102 716 451 980 $ US | 9 648 583 225 $ US |
| 1975 | 98 473 832 017 $ US | 10 237 343 174 $ US |
| 1974 | 99 526 597 934 $ US | 9 596 960 180 $ US |
| 1973 | 85 517 673 173 $ US | 7 870 239 461 $ US |
| 1972 | 71 464 700 667 $ US | 6 173 712 814 $ US |
| 1971 | 67 351 404 352 $ US | 5 594 770 359 $ US |
| 1970 | 62 422 483 055 $ US | 4 877 684 910 $ US |
| 1969 | 58 447 995 017 $ US | 5 032 434 970 $ US |
| 1968 | 53 085 455 871 $ US | 3 909 780 539 $ US |
| 1967 | 50 134 942 204 $ US | 3 384 063 372 $ US |
| 1966 | 45 581 230 504 $ US | 4 532 660 182 $ US |
| 1965 | 59 556 105 229 $ US | 4 043 901 818 $ US |
| 1964 | 56 480 289 941 $ US | 2 881 545 273 $ US |
| 1963 | 48 421 923 459 $ US | 6 213 185 743 $ US |
| 1962 | 42 161 481 858 $ US | 3 779 841 429 $ US |
| 1961 | 39 232 435 784 $ US | 3 086 746 857 $ US |
| 1960 | 37 029 883 876 $ US | 3 359 404 118 $ US |
En 2025, le PIB de l'Inde (3,96 billions de dollars US) était 43 fois celui de la République démocratique du Congo (91 milliards de dollars US). En 2015, le rapport était de 52. De 2015 à 2025, à prix constants de 2015, le PIB de l'Inde a progressé de 75,6 % et celui de la République démocratique du Congo de 59,4 %.
Depuis 1960, le PIB de l'Inde a chaque année été le plus élevé des deux ; en 1960, il était 11 fois celui de la République démocratique du Congo. En 2025, le PIB par habitant était de 2 702 $ US en Inde et de 807 $ US en République démocratique du Congo, soit 3,3 fois plus élevé en Inde.
Inde vs République démocratique du Congo : derniers chiffres du PIB
|
Inde
|
RDC
|
|
|---|---|---|
| PIB, dollars US courants | 3,96 Bn $US | 91,0 Md $US |
| Rang mondial | 6/197 | 81/197 |
| Part mondiale | 3,34 % | 0,08 % |
| PIB, dollars US constants de 2015 | 3,69 Bn $US | 64,0 Md $US |
| Écart de PIB | 43× | 0,023× |
Comparer le PIB de 2 pays au choix
Sources :
- Banque mondiale | Économie et croissance (1960–2025, mis à jour en octobre 2026)
Creative Commons Attribution (CC BY) : vous pouvez copier, partager, adapter et réutiliser ce contenu, y compris à des fins commerciales, à condition de citer statistics.wiki et d’indiquer les modifications apportées. Les sources citées ci-dessus peuvent avoir leurs propres conditions de licence.