
Grèce vs Croatie : PIB, 1960–2025
| Année | PIB, dollars US courants | |
|---|---|---|
 Grèce |
 Croatie |
|
| 2025 | 280 635 521 324 $ US | 105 060 182 186 $ US |
| 2024 | 256 238 371 778 $ US | 92 981 894 168 $ US |
| 2023 | 242 946 187 738 $ US | 85 621 337 533 $ US |
| 2022 | 217 990 189 601 $ US | 71 196 460 237 $ US |
| 2021 | 218 303 801 895 $ US | 69 002 262 505 $ US |
| 2020 | 191 362 985 555 $ US | 57 959 824 238 $ US |
| 2019 | 207 305 649 887 $ US | 61 467 261 345 $ US |
| 2018 | 213 298 873 494 $ US | 61 668 280 700 $ US |
| 2017 | 200 381 103 984 $ US | 56 182 225 079 $ US |
| 2016 | 193 097 239 006 $ US | 52 650 804 052 $ US |
| 2015 | 194 567 373 678 $ US | 50 999 271 059 $ US |
| 2014 | 233 911 581 521 $ US | 59 607 109 597 $ US |
| 2013 | 236 556 279 641 $ US | 59 846 869 999 $ US |
| 2012 | 238 841 140 018 $ US | 57 547 495 860 $ US |
| 2011 | 283 228 079 776 $ US | 62 889 150 894 $ US |
| 2010 | 296 417 644 404 $ US | 58 975 127 201 $ US |
| 2009 | 326 829 054 686 $ US | 62 315 450 611 $ US |
| 2008 | 351 121 399 546 $ US | 68 473 103 477 $ US |
| 2007 | 314 226 996 944 $ US | 59 290 547 254 $ US |
| 2006 | 269 073 415 334 $ US | 49 583 643 048 $ US |
| 2005 | 242 315 668 619 $ US | 45 012 776 906 $ US |
| 2004 | 234 979 615 898 $ US | 41 836 096 243 $ US |
| 2003 | 196 930 509 813 $ US | 35 244 797 329 $ US |
| 2002 | 150 253 800 086 $ US | 26 757 633 353 $ US |
| 2001 | 132 050 474 720 $ US | 23 067 071 478 $ US |
| 2000 | 125 760 166 225 $ US | 22 134 069 750 $ US |
| 1999 | 137 131 371 955 $ US | 23 776 940 769 $ US |
| 1998 | 139 612 812 176 $ US | 25 889 813 449 $ US |
| 1997 | 138 766 067 640 $ US | 24 175 272 572 $ US |
| 1996 | 142 502 984 145 $ US | 24 151 469 717 $ US |
| 1995 | 134 974 613 914 $ US | 22 772 224 146 $ US |
| 1994 | 114 980 063 202 $ US | 15 062 911 617 $ US |
| 1993 | 107 295 704 518 $ US | 11 259 647 874 $ US |
| 1992 | 114 608 178 405 $ US | 10 621 169 291 $ US |
| 1991 | 103 680 863 713 $ US | 18 760 386 775 $ US |
| 1990 | 96 529 587 274 $ US | 25 650 213 280 $ US |
| 1989 | 78 067 933 277 $ US | - |
| 1988 | 75 200 610 137 $ US | - |
| 1987 | 64 739 630 096 $ US | - |
| 1986 | 55 595 445 472 $ US | - |
| 1985 | 47 155 741 426 $ US | - |
| 1984 | 47 352 146 312 $ US | - |
| 1983 | 48 741 397 059 $ US | - |
| 1982 | 53 858 346 939 $ US | - |
| 1981 | 51 618 456 335 $ US | - |
| 1980 | 56 039 256 595 $ US | - |
| 1979 | 53 724 121 435 $ US | - |
| 1978 | 43 654 480 519 $ US | - |
| 1977 | 35 673 080 481 $ US | - |
| 1976 | 30 719 552 239 $ US | - |
| 1975 | 28 129 128 587 $ US | - |
| 1974 | 24 998 715 909 $ US | - |
| 1973 | 22 037 019 563 $ US | - |
| 1972 | 16 650 659 091 $ US | - |
| 1971 | 14 388 806 818 $ US | - |
| 1970 | 12 957 113 636 $ US | - |
| 1969 | 11 454 106 327 $ US | - |
| 1968 | 9 950 331 206 $ US | - |
| 1967 | 9 146 592 856 $ US | - |
| 1966 | 8 472 021 467 $ US | - |
| 1965 | 7 582 209 670 $ US | - |
| 1964 | 6 576 906 345 $ US | - |
| 1963 | 5 813 285 627 $ US | - |
| 1962 | 5 140 542 929 $ US | - |
| 1961 | 4 892 397 431 $ US | - |
| 1960 | 4 274 890 307 $ US | - |
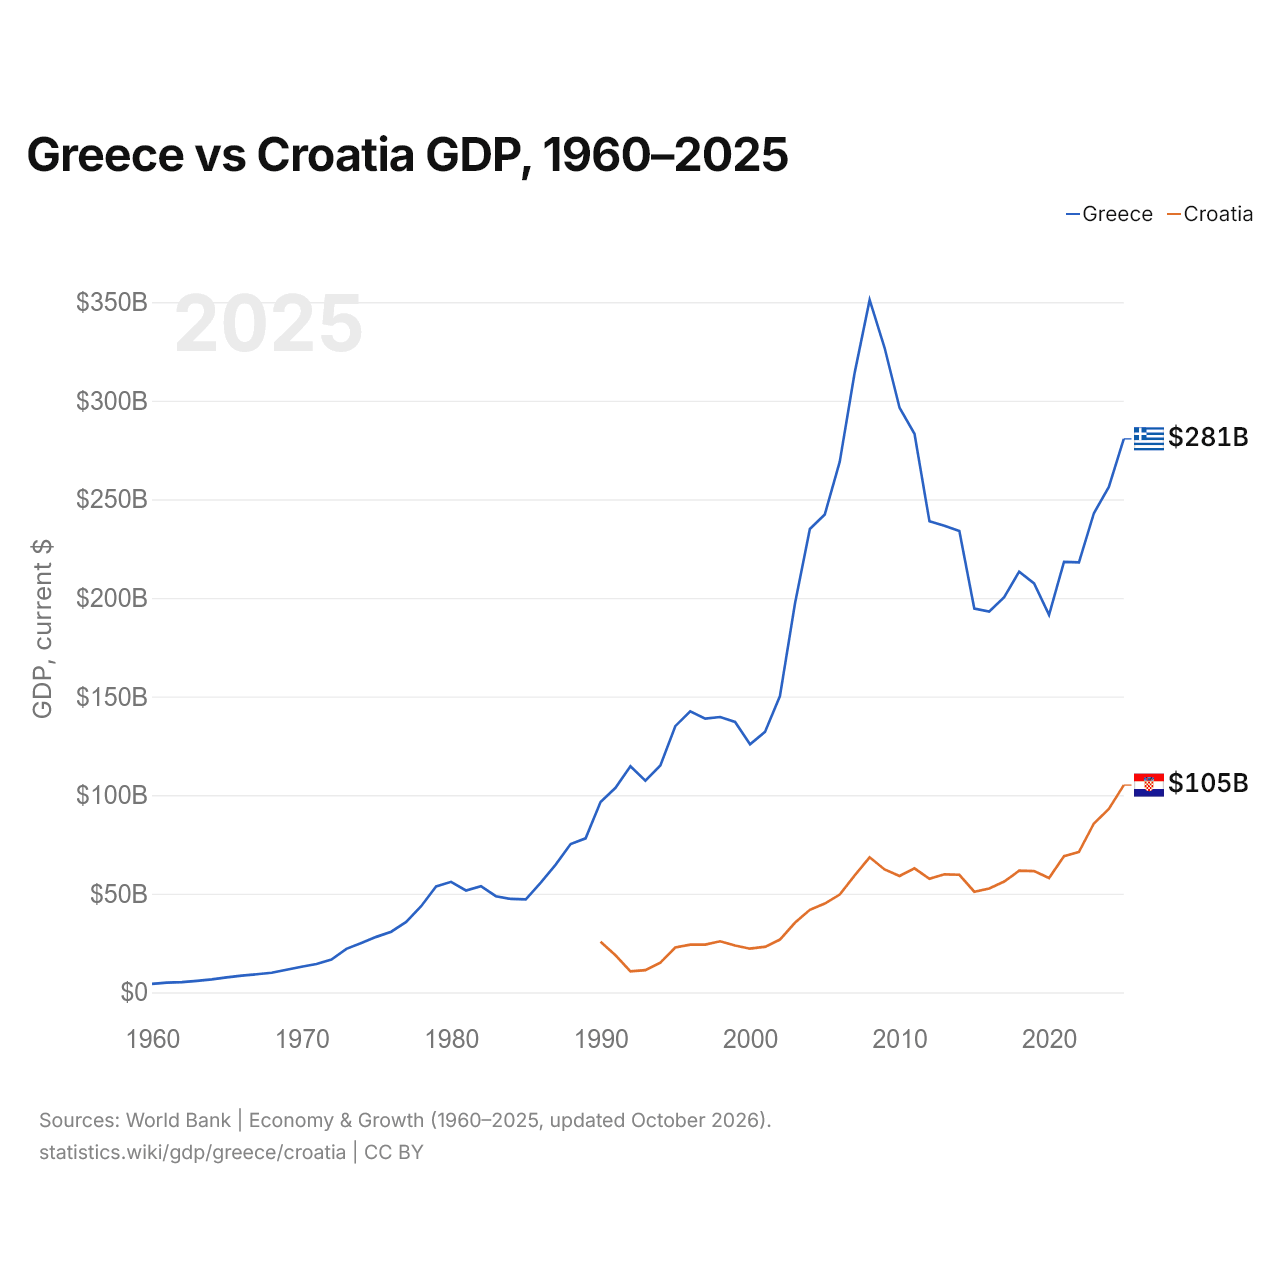
En 2025, le PIB de la Grèce (281 milliards de dollars US) était 2,7 fois celui de la Croatie (105 milliards de dollars US). En 2015, le rapport était de 3,8. De 2015 à 2025, à prix constants de 2015, le PIB de la Grèce a progressé de 17,3 % et celui de la Croatie de 40,0 %.
Depuis 1990, le PIB de la Grèce a chaque année été le plus élevé des deux ; en 1990, il était 3,8 fois celui de la Croatie. En 2025, le PIB par habitant était de 26 948 $ US en Grèce et de 27 104 $ US en Croatie, à peu près le même.
Grèce vs Croatie : derniers chiffres du PIB
|
Grèce
|
Croatie
|
|
|---|---|---|
| PIB, dollars US courants | 281 Md $US | 105 Md $US |
| Rang mondial | 52/197 | 73/197 |
| Part mondiale | 0,24 % | 0,09 % |
| PIB, dollars US constants de 2015 | 228 Md $US | 71,4 Md $US |
| Écart de PIB | 2,7× | 0,37× |
Comparer le PIB de 2 pays au choix
Sources :
- Banque mondiale | Économie et croissance (1960–2025, mis à jour en octobre 2026)
Creative Commons Attribution (CC BY) : vous pouvez copier, partager, adapter et réutiliser ce contenu, y compris à des fins commerciales, à condition de citer statistics.wiki et d’indiquer les modifications apportées. Les sources citées ci-dessus peuvent avoir leurs propres conditions de licence.