
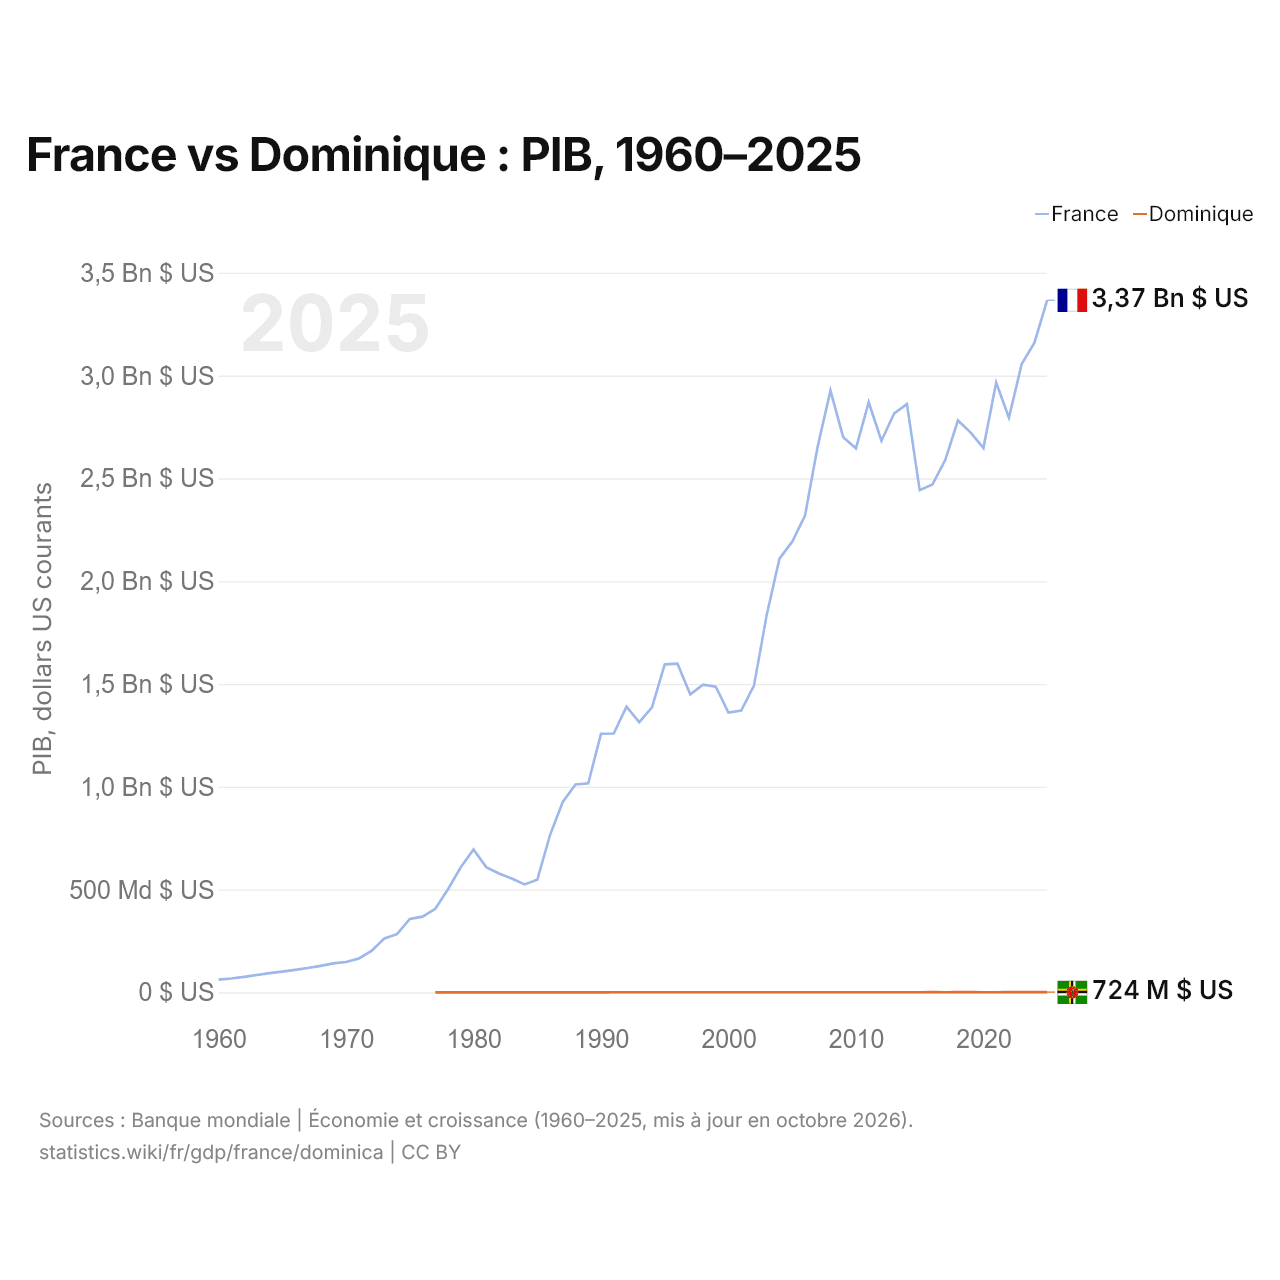
France vs Dominique : PIB, 1960–2025
| Année | PIB, dollars US courants | |
|---|---|---|
 France |
 Dominique |
|
| 2025 | 3 366 315 927 447 $ US | 723 859 259 $ US |
| 2024 | 3 160 442 622 465 $ US | 688 881 481 $ US |
| 2023 | 3 056 250 648 138 $ US | 659 311 111 $ US |
| 2022 | 2 794 788 137 067 $ US | 623 062 963 $ US |
| 2021 | 2 966 433 692 008 $ US | 562 911 111 $ US |
| 2020 | 2 647 926 055 110 $ US | 528 944 444 $ US |
| 2019 | 2 722 793 515 172 $ US | 644 259 259 $ US |
| 2018 | 2 781 576 320 884 $ US | 628 244 444 $ US |
| 2017 | 2 588 868 323 335 $ US | 563 355 556 $ US |
| 2016 | 2 470 407 619 777 $ US | 612 711 111 $ US |
| 2015 | 2 442 483 452 643 $ US | 583 177 778 $ US |
| 2014 | 2 861 236 112 552 $ US | 572 255 556 $ US |
| 2013 | 2 816 077 607 875 $ US | 545 325 926 $ US |
| 2012 | 2 683 007 095 787 $ US | 520 355 556 $ US |
| 2011 | 2 870 408 553 990 $ US | 532 081 481 $ US |
| 2010 | 2 646 230 027 988 $ US | 519 859 259 $ US |
| 2009 | 2 700 075 882 519 $ US | 515 618 519 $ US |
| 2008 | 2 926 802 941 586 $ US | 480 003 704 $ US |
| 2007 | 2 655 816 911 867 $ US | 444 685 185 $ US |
| 2006 | 2 317 861 544 691 $ US | 416 674 074 $ US |
| 2005 | 2 192 146 403 028 $ US | 391 455 556 $ US |
| 2004 | 2 109 792 297 237 $ US | 396 711 111 $ US |
| 2003 | 1 835 095 983 049 $ US | 373 318 519 $ US |
| 2002 | 1 492 427 756 382 $ US | 375 200 000 $ US |
| 2001 | 1 370 376 677 299 $ US | 377 462 963 $ US |
| 2000 | 1 360 959 069 477 $ US | 333 470 370 $ US |
| 1999 | 1 486 915 879 702 $ US | 331 759 259 $ US |
| 1998 | 1 496 906 382 032 $ US | 322 411 111 $ US |
| 1997 | 1 449 392 222 971 $ US | 302 988 889 $ US |
| 1996 | 1 598 889 216 566 $ US | 292 285 185 $ US |
| 1995 | 1 595 219 345 512 $ US | 274 522 222 $ US |
| 1994 | 1 385 822 778 828 $ US | 264 374 074 $ US |
| 1993 | 1 314 383 368 080 $ US | 245 525 926 $ US |
| 1992 | 1 389 663 073 110 $ US | 234 059 259 $ US |
| 1991 | 1 258 961 748 634 $ US | 219 762 963 $ US |
| 1990 | 1 257 649 439 827 $ US | 201 429 630 $ US |
| 1989 | 1 016 742 237 302 $ US | 185 137 243 $ US |
| 1988 | 1 010 827 662 152 $ US | 171 106 184 $ US |
| 1987 | 926 320 855 615 $ US | 151 868 754 $ US |
| 1986 | 764 946 585 851 $ US | 135 161 959 $ US |
| 1985 | 547 220 981 165 $ US | 119 491 933 $ US |
| 1984 | 525 033 325 828 $ US | 109 157 071 $ US |
| 1983 | 553 356 312 936 $ US | 98 665 191 $ US |
| 1982 | 578 152 310 610 $ US | 89 527 577 $ US |
| 1981 | 609 184 791 792 $ US | 82 107 391 $ US |
| 1980 | 694 529 183 483 $ US | 72 804 653 $ US |
| 1979 | 608 218 624 730 $ US | 55 017 759 $ US |
| 1978 | 501 724 418 605 $ US | 57 130 216 $ US |
| 1977 | 406 401 711 688 $ US | 45 872 947 $ US |
| 1976 | 368 363 152 144 $ US | - |
| 1975 | 357 324 307 786 $ US | - |
| 1974 | 282 739 225 314 $ US | - |
| 1973 | 261 970 536 240 $ US | - |
| 1972 | 201 738 881 664 $ US | - |
| 1971 | 164 694 210 962 $ US | - |
| 1970 | 147 312 861 698 $ US | - |
| 1969 | 140 660 914 841 $ US | - |
| 1968 | 128 710 572 572 $ US | - |
| 1967 | 118 088 635 381 $ US | - |
| 1966 | 109 306 730 313 $ US | - |
| 1965 | 100 927 668 584 $ US | - |
| 1964 | 93 424 179 943 $ US | - |
| 1963 | 84 227 606 650 $ US | - |
| 1962 | 75 196 980 365 $ US | - |
| 1961 | 67 158 050 215 $ US | - |
| 1960 | 61 959 085 885 $ US | - |
En 2025, le PIB de la France (3,37 billions de dollars US) était 4 700 fois celui de la Dominique (724 millions de dollars US). En 2015, le rapport était de 4 200. De 2015 à 2025, à prix constants de 2015, le PIB de la France a progressé de 12,3 % et celui de la Dominique de 7,3 %.
Depuis 1977, le PIB de la France a chaque année été le plus élevé des deux ; en 1977, il était 8 900 fois celui de la Dominique. En 2025, le PIB par habitant était de 48 986 $ US en France et de 10 989 $ US à la Dominique, soit 4,5 fois plus élevé en France.
France vs Dominique : derniers chiffres du PIB
|
France
|
Dominique
|
|
|---|---|---|
| PIB, dollars US courants | 3,37 Bn $US | 724 M $US |
| Rang mondial | 7/197 | 190/197 |
| Part mondiale | 2,84 % | <0,001 % |
| PIB, dollars US constants de 2015 | 2,74 Bn $US | 626 M $US |
| Écart de PIB | 4 651× | 0,00022× |
Comparer le PIB de 2 pays au choix
Sources :
- Banque mondiale | Économie et croissance (1960–2025, mis à jour en octobre 2026)
Creative Commons Attribution (CC BY) : vous pouvez copier, partager, adapter et réutiliser ce contenu, y compris à des fins commerciales, à condition de citer statistics.wiki et d’indiquer les modifications apportées. Les sources citées ci-dessus peuvent avoir leurs propres conditions de licence.