
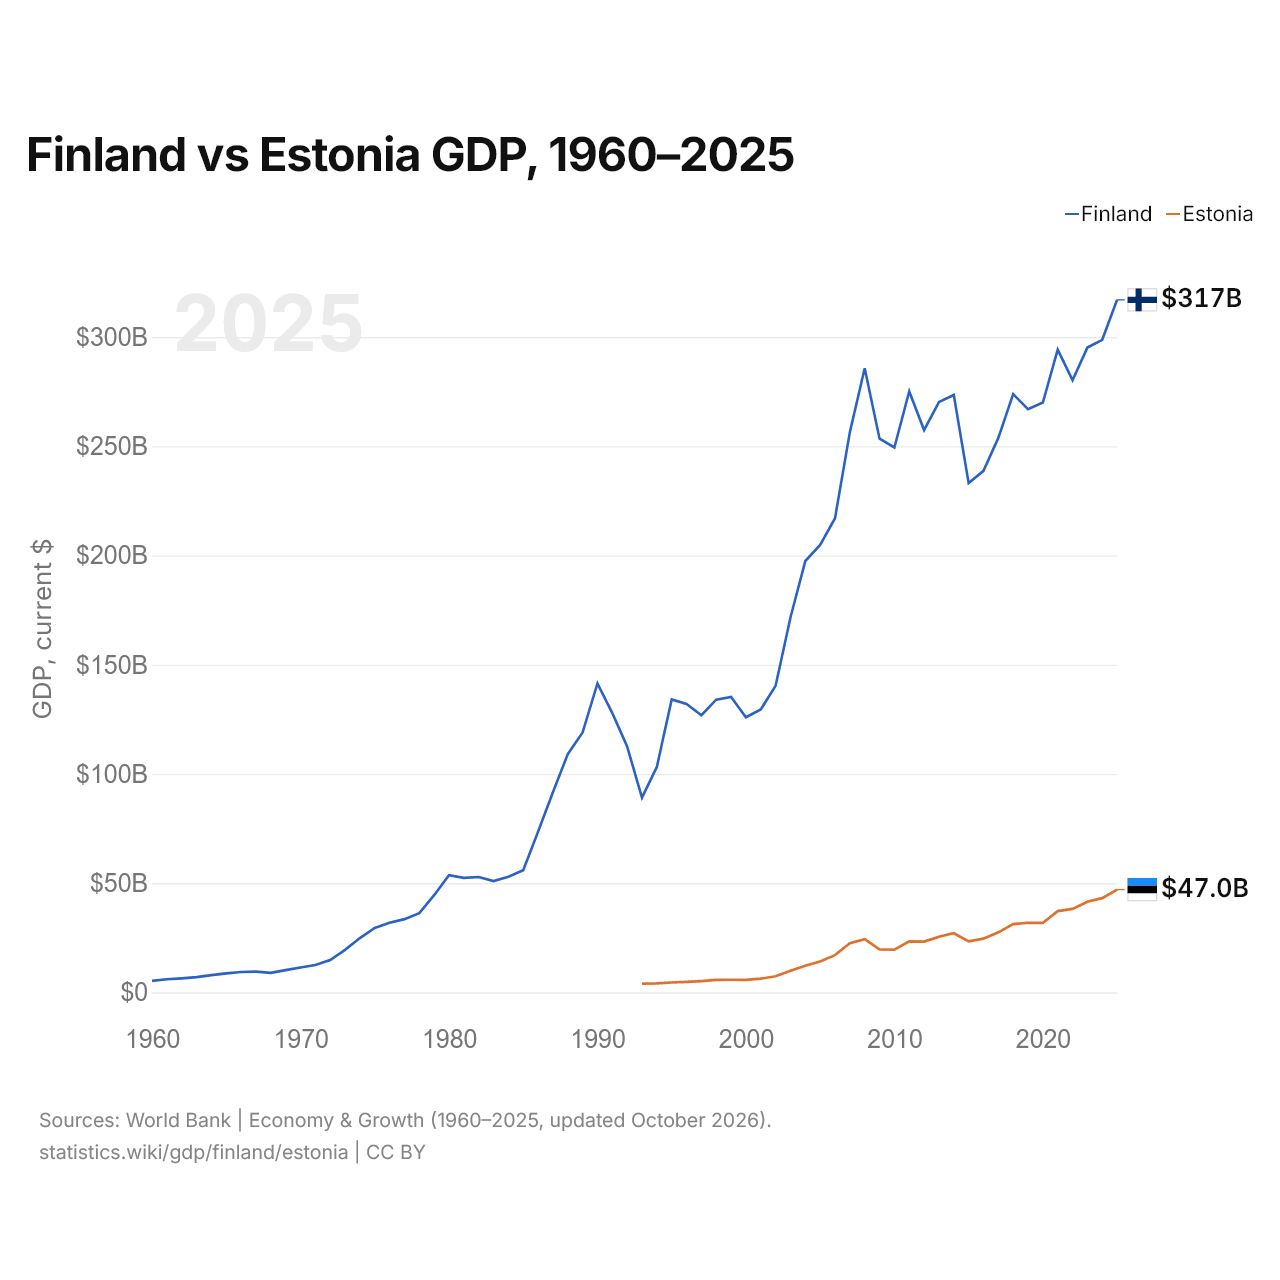
Finlande vs Estonie : PIB, 1960–2025
| Année | PIB, dollars US courants | |
|---|---|---|
 Finlande |
 Estonie |
|
| 2025 | 317 039 368 820 $ US | 47 030 833 799 $ US |
| 2024 | 298 729 432 712 $ US | 43 130 419 829 $ US |
| 2023 | 295 191 741 637 $ US | 41 470 344 395 $ US |
| 2022 | 280 253 099 309 $ US | 38 226 641 740 $ US |
| 2021 | 294 223 210 496 $ US | 37 201 101 171 $ US |
| 2020 | 270 000 311 606 $ US | 31 820 771 494 $ US |
| 2019 | 267 014 821 129 $ US | 31 873 748 770 $ US |
| 2018 | 273 869 255 596 $ US | 31 222 632 741 $ US |
| 2017 | 253 846 138 440 $ US | 27 469 461 919 $ US |
| 2016 | 238 777 818 793 $ US | 24 561 027 788 $ US |
| 2015 | 233 210 733 506 $ US | 23 311 847 751 $ US |
| 2014 | 273 478 528 955 $ US | 27 055 689 003 $ US |
| 2013 | 270 268 036 626 $ US | 25 451 032 781 $ US |
| 2012 | 257 443 384 493 $ US | 23 237 406 116 $ US |
| 2011 | 275 126 915 516 $ US | 23 303 915 795 $ US |
| 2010 | 249 429 613 683 $ US | 19 524 355 419 $ US |
| 2009 | 253 480 783 439 $ US | 19 633 984 440 $ US |
| 2008 | 285 698 662 071 $ US | 24 342 935 404 $ US |
| 2007 | 256 360 251 538 $ US | 22 450 264 166 $ US |
| 2006 | 217 044 068 234 $ US | 17 025 671 810 $ US |
| 2005 | 204 859 368 791 $ US | 14 109 491 357 $ US |
| 2004 | 197 458 297 640 $ US | 12 148 595 031 $ US |
| 2003 | 171 612 867 736 $ US | 9 876 595 528 $ US |
| 2002 | 140 360 963 812 $ US | 7 370 119 619 $ US |
| 2001 | 129 519 672 869 $ US | 6 250 218 423 $ US |
| 2000 | 125 967 821 111 $ US | 5 686 579 748 $ US |
| 1999 | 135 234 241 918 $ US | 5 756 912 266 $ US |
| 1998 | 133 990 876 725 $ US | 5 674 080 543 $ US |
| 1997 | 126 862 902 302 $ US | 5 154 420 649 $ US |
| 1996 | 131 991 975 149 $ US | 4 786 018 988 $ US |
| 1995 | 134 060 457 516 $ US | 4 502 970 889 $ US |
| 1994 | 103 182 697 780 $ US | 4 123 011 420 $ US |
| 1993 | 89 112 105 756 $ US | 4 013 091 682 $ US |
| 1992 | 112 537 828 511 $ US | - |
| 1991 | 127 794 441 994 $ US | - |
| 1990 | 141 446 120 355 $ US | - |
| 1989 | 118 991 270 611 $ US | - |
| 1988 | 109 039 090 263 $ US | - |
| 1987 | 91 564 993 913 $ US | - |
| 1986 | 73 511 611 541 $ US | - |
| 1985 | 55 856 676 899 $ US | - |
| 1984 | 52 870 993 273 $ US | - |
| 1983 | 50 956 447 481 $ US | - |
| 1982 | 52 784 013 815 $ US | - |
| 1981 | 52 440 066 134 $ US | - |
| 1980 | 53 649 984 061 $ US | - |
| 1979 | 44 469 218 440 $ US | - |
| 1978 | 36 259 392 058 $ US | - |
| 1977 | 33 502 784 418 $ US | - |
| 1976 | 31 852 352 670 $ US | - |
| 1975 | 29 475 251 333 $ US | - |
| 1974 | 24 851 036 710 $ US | - |
| 1973 | 19 474 098 335 $ US | - |
| 1972 | 14 744 499 570 $ US | - |
| 1971 | 12 528 522 307 $ US | - |
| 1970 | 11 358 529 162 $ US | - |
| 1969 | 10 177 524 839 $ US | - |
| 1968 | 8 916 565 041 $ US | - |
| 1967 | 9 468 272 357 $ US | - |
| 1966 | 9 306 142 172 $ US | - |
| 1965 | 8 680 393 839 $ US | - |
| 1964 | 7 848 987 793 $ US | - |
| 1963 | 6 958 916 548 $ US | - |
| 1962 | 6 407 796 043 $ US | - |
| 1961 | 5 984 433 774 $ US | - |
| 1960 | 5 279 481 824 $ US | - |
En 2025, le PIB de la Finlande (317 milliards de dollars US) était 6,7 fois celui de l'Estonie (47 milliards de dollars US). En 2015, le rapport était de 10. De 2015 à 2025, à prix constants de 2015, le PIB de la Finlande a progressé de 8,8 % et celui de l'Estonie de 18,9 %.
Depuis 1993, le PIB de la Finlande a chaque année été le plus élevé des deux ; en 1993, il était 22 fois celui de l'Estonie. En 2025, le PIB par habitant était de 56 149 $ US en Finlande et de 34 418 $ US en Estonie, soit 1,6 fois plus élevé en Finlande.
Finlande vs Estonie : derniers chiffres du PIB
|
Finlande
|
Estonie
|
|
|---|---|---|
| PIB, dollars US courants | 317 Md $US | 47,0 Md $US |
| Rang mondial | 48/197 | 101/197 |
| Part mondiale | 0,27 % | 0,04 % |
| PIB, dollars US constants de 2015 | 254 Md $US | 27,7 Md $US |
| Écart de PIB | 6,7× | 0,15× |
Comparer le PIB de 2 pays au choix
Sources :
- Banque mondiale | Économie et croissance (1960–2025, mis à jour en octobre 2026)
Creative Commons Attribution (CC BY) : vous pouvez copier, partager, adapter et réutiliser ce contenu, y compris à des fins commerciales, à condition de citer statistics.wiki et d’indiquer les modifications apportées. Les sources citées ci-dessus peuvent avoir leurs propres conditions de licence.