
Belgique vs Bangladesh : PIB, 1960–2025
| Année | PIB, dollars US courants | |
|---|---|---|
 Belgique |
 Bangladesh |
|
| 2025 | 725 466 462 860 $ US | 456 319 229 256 $ US |
| 2024 | 670 983 130 619 $ US | 450 119 432 069 $ US |
| 2023 | 650 779 364 364 $ US | 437 415 333 018 $ US |
| 2022 | 591 474 463 579 $ US | 460 131 689 083 $ US |
| 2021 | 598 522 422 242 $ US | 416 271 647 911 $ US |
| 2020 | 529 694 473 502 $ US | 373 979 442 362 $ US |
| 2019 | 536 726 344 405 $ US | 351 231 654 604 $ US |
| 2018 | 542 638 913 428 $ US | 321 362 752 442 $ US |
| 2017 | 500 908 767 352 $ US | 293 732 446 625 $ US |
| 2016 | 474 271 566 740 $ US | 265 224 515 675 $ US |
| 2015 | 461 044 767 545 $ US | 195 146 608 978 $ US |
| 2014 | 537 987 419 164 $ US | 172 886 611 654 $ US |
| 2013 | 524 097 026 599 $ US | 149 998 957 434 $ US |
| 2012 | 498 414 364 945 $ US | 133 310 747 603 $ US |
| 2011 | 527 196 649 049 $ US | 128 607 482 310 $ US |
| 2010 | 481 556 503 720 $ US | 115 275 540 051 $ US |
| 2009 | 485 014 525 992 $ US | 102 475 158 191 $ US |
| 2008 | 517 328 087 920 $ US | 91 636 997 371 $ US |
| 2007 | 470 922 156 309 $ US | 79 611 644 975 $ US |
| 2006 | 408 259 840 869 $ US | 71 795 736 172 $ US |
| 2005 | 385 714 762 230 $ US | 69 476 001 239 $ US |
| 2004 | 369 214 712 443 $ US | 65 108 544 250 $ US |
| 2003 | 318 082 528 507 $ US | 60 158 929 188 $ US |
| 2002 | 258 383 599 375 $ US | 54 724 081 491 $ US |
| 2001 | 236 746 141 604 $ US | 53 991 289 844 $ US |
| 2000 | 236 792 460 312 $ US | 53 369 787 319 $ US |
| 1999 | 258 245 733 221 $ US | 51 270 569 884 $ US |
| 1998 | 258 528 339 631 $ US | 49 984 559 471 $ US |
| 1997 | 252 708 051 421 $ US | 48 244 309 133 $ US |
| 1996 | 279 201 433 225 $ US | 46 438 484 108 $ US |
| 1995 | 288 025 588 396 $ US | 37 939 748 769 $ US |
| 1994 | 244 884 129 491 $ US | 33 768 660 883 $ US |
| 1993 | 224 721 795 709 $ US | 33 166 519 418 $ US |
| 1992 | 234 781 652 447 $ US | 31 708 874 594 $ US |
| 1991 | 210 510 999 409 $ US | 30 957 483 950 $ US |
| 1990 | 205 331 747 948 $ US | 31 598 340 778 $ US |
| 1989 | 164 221 056 511 $ US | 28 781 715 189 $ US |
| 1988 | 162 299 103 675 $ US | 26 579 005 558 $ US |
| 1987 | 149 394 404 106 $ US | 24 298 032 258 $ US |
| 1986 | 120 018 787 249 $ US | 21 774 033 333 $ US |
| 1985 | 86 268 264 148 $ US | 22 278 423 077 $ US |
| 1984 | 83 349 530 159 $ US | 18 920 840 000 $ US |
| 1983 | 87 184 239 053 $ US | 17 609 048 822 $ US |
| 1982 | 92 095 926 188 $ US | 18 525 399 202 $ US |
| 1981 | 104 730 018 470 $ US | 20 249 694 002 $ US |
| 1980 | 126 829 314 388 $ US | 18 138 049 096 $ US |
| 1979 | 116 315 456 797 $ US | 15 565 480 322 $ US |
| 1978 | 101 246 526 194 $ US | 13 281 767 143 $ US |
| 1977 | 82 839 905 459 $ US | 9 651 149 302 $ US |
| 1976 | 71 113 882 968 $ US | 10 117 113 333 $ US |
| 1975 | 65 678 189 097 $ US | 19 448 348 073 $ US |
| 1974 | 56 033 077 879 $ US | 12 512 460 520 $ US |
| 1973 | 47 743 801 490 $ US | 8 086 725 729 $ US |
| 1972 | 37 209 418 019 $ US | 6 288 245 867 $ US |
| 1971 | 29 821 661 870 $ US | 8 751 843 188 $ US |
| 1970 | 26 706 196 047 $ US | 8 992 722 167 $ US |
| 1969 | 24 019 653 475 $ US | 8 471 006 438 $ US |
| 1968 | 21 654 856 965 $ US | 7 483 685 771 $ US |
| 1967 | 20 252 508 995 $ US | 7 253 575 688 $ US |
| 1966 | 18 894 891 312 $ US | 6 439 687 854 $ US |
| 1965 | 17 597 783 297 $ US | 5 906 636 792 $ US |
| 1964 | 16 168 044 450 $ US | 5 386 054 833 $ US |
| 1963 | 14 445 805 381 $ US | 5 319 458 563 $ US |
| 1962 | 13 436 827 167 $ US | 5 081 413 542 $ US |
| 1961 | 12 561 701 694 $ US | 4 817 580 375 $ US |
| 1960 | 11 810 619 368 $ US | 4 274 894 083 $ US |
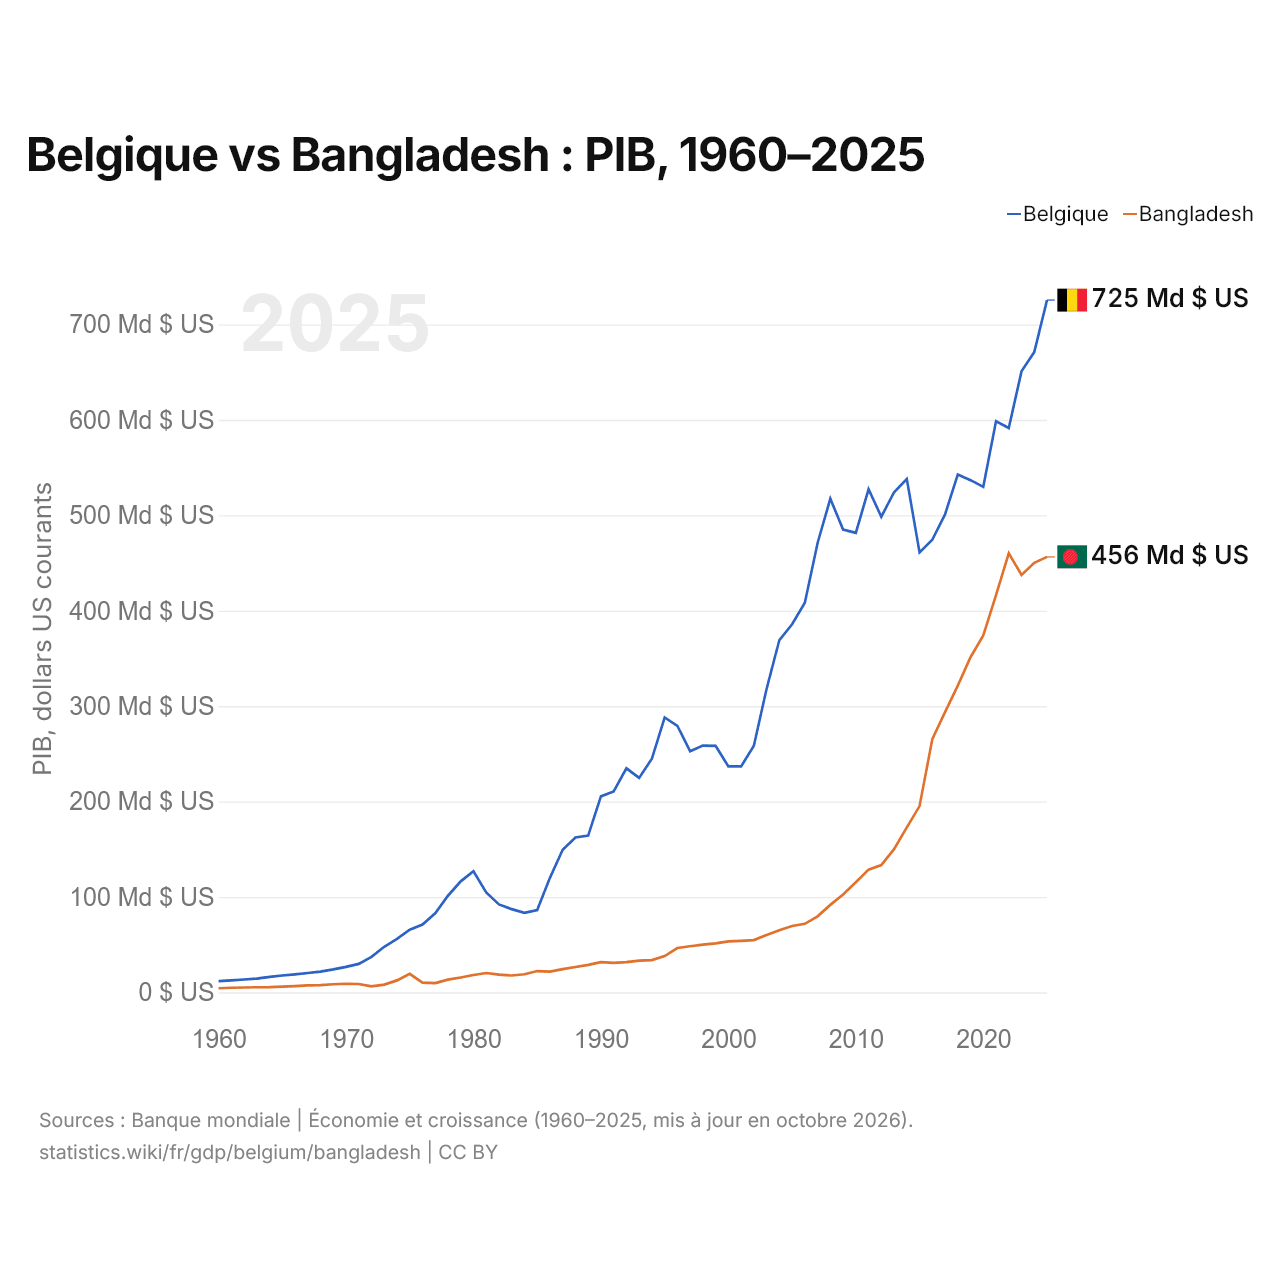
En 2025, le PIB de la Belgique (725 milliards de dollars US) était 1,6 fois celui du Bangladesh (456 milliards de dollars US). En 2015, le rapport était de 2,4. De 2015 à 2025, à prix constants de 2015, le PIB de la Belgique a progressé de 16,9 % et celui du Bangladesh de 78,7 %.
Depuis 1960, le PIB de la Belgique a chaque année été le plus élevé des deux ; en 1960, il était 2,8 fois celui du Bangladesh. En 2025, le PIB par habitant était de 60 750 $ US en Belgique et de 2 597 $ US au Bangladesh, soit 23 fois plus élevé en Belgique. En parité de pouvoir d'achat, l'ordre s'inverse : le PIB (PPA) est de 1,78 billion de dollars au Bangladesh et de 892 milliards de dollars en Belgique.
Belgique vs Bangladesh : derniers chiffres du PIB
|
Belgique
|
Bangladesh
|
|
|---|---|---|
| PIB, dollars US courants | 725 Md $US | 456 Md $US |
| Rang mondial | 23/197 | 38/197 |
| Part mondiale | 0,61 % | 0,39 % |
| PIB, dollars US constants de 2015 | 539 Md $US | 349 Md $US |
| Écart de PIB | 1,6× | 0,63× |
Comparer le PIB de 2 pays au choix
Sources :
- Banque mondiale | Économie et croissance (1960–2025, mis à jour en octobre 2026)
Creative Commons Attribution (CC BY) : vous pouvez copier, partager, adapter et réutiliser ce contenu, y compris à des fins commerciales, à condition de citer statistics.wiki et d’indiquer les modifications apportées. Les sources citées ci-dessus peuvent avoir leurs propres conditions de licence.