
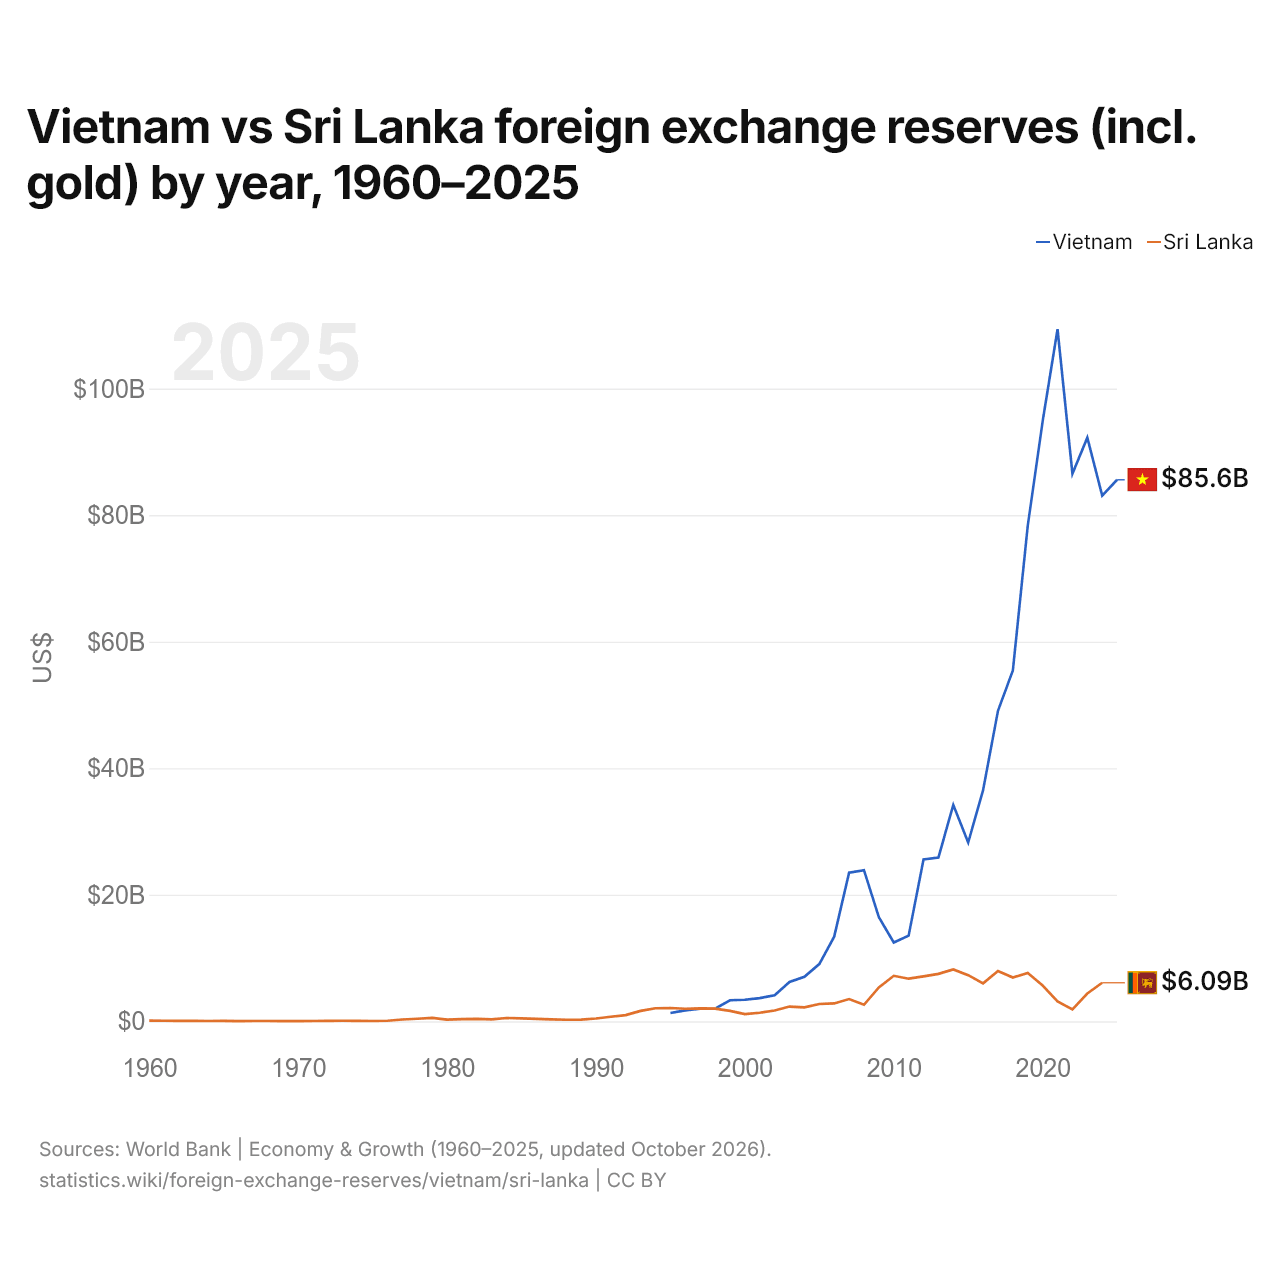
Vietnam vs Sri Lanka : réserves de change (or compris) par année, 1960–2025
| Année | $ US | |
|---|---|---|
 Vietnam |
 Sri Lanka |
|
| 2025 | 85 580 367 981 $ US | - |
| 2024 | 83 081 854 928 $ US | 6 093 946 546 $ US |
| 2023 | 92 237 540 812 $ US | 4 405 117 005 $ US |
| 2022 | 86 539 530 967 $ US | 1 896 231 717 $ US |
| 2021 | 109 371 353 443 $ US | 3 136 991 506 $ US |
| 2020 | 94 833 616 150 $ US | 5 663 994 385 $ US |
| 2019 | 78 334 835 183 $ US | 7 648 305 273 $ US |
| 2018 | 55 452 622 583 $ US | 6 920 825 566 $ US |
| 2017 | 49 075 567 812 $ US | 7 959 047 615 $ US |
| 2016 | 36 527 291 044 $ US | 6 008 199 165 $ US |
| 2015 | 28 250 254 960 $ US | 7 302 096 590 $ US |
| 2014 | 34 189 368 833 $ US | 8 210 750 128 $ US |
| 2013 | 25 893 489 673 $ US | 7 500 000 872 $ US |
| 2012 | 25 573 282 232 $ US | 7 106 460 349 $ US |
| 2011 | 13 539 119 001 $ US | 6 739 196 545 $ US |
| 2010 | 12 466 600 611 $ US | 7 195 358 507 $ US |
| 2009 | 16 447 104 124 $ US | 5 353 610 216 $ US |
| 2008 | 23 890 250 550 $ US | 2 616 559 583 $ US |
| 2007 | 23 479 392 780 $ US | 3 518 418 228 $ US |
| 2006 | 13 384 067 982 $ US | 2 832 098 099 $ US |
| 2005 | 9 050 561 631 $ US | 2 734 967 767 $ US |
| 2004 | 7 041 460 610 $ US | 2 204 868 879 $ US |
| 2003 | 6 224 181 088 $ US | 2 333 781 502 $ US |
| 2002 | 4 121 051 661 $ US | 1 705 155 737 $ US |
| 2001 | 3 674 565 623 $ US | 1 357 451 866 $ US |
| 2000 | 3 416 511 105 $ US | 1 131 355 289 $ US |
| 1999 | 3 326 147 673 $ US | 1 653 729 058 $ US |
| 1998 | 2 002 261 885 $ US | 1 997 795 168 $ US |
| 1997 | 1 985 854 206 $ US | 2 042 319 937 $ US |
| 1996 | 1 735 897 757 $ US | 1 984 681 033 $ US |
| 1995 | 1 323 681 930 $ US | 2 111 952 625 $ US |
| 1994 | - | 2 069 716 926 $ US |
| 1993 | - | 1 653 805 493 $ US |
| 1992 | - | 979 865 101 $ US |
| 1991 | - | 724 220 186 $ US |
| 1990 | - | 447 030 482 $ US |
| 1989 | - | 269 432 908 $ US |
| 1988 | - | 247 726 248 $ US |
| 1987 | - | 309 506 427 $ US |
| 1986 | - | 377 188 001 $ US |
| 1985 | - | 471 725 042 $ US |
| 1984 | - | 530 159 876 $ US |
| 1983 | - | 320 947 713 $ US |
| 1982 | - | 380 230 471 $ US |
| 1981 | - | 352 359 462 $ US |
| 1980 | - | 282 580 140 $ US |
| 1979 | - | 549 102 779 $ US |
| 1978 | - | 407 115 688 $ US |
| 1977 | - | 292 587 751 $ US |
| 1976 | - | 92 329 947 $ US |
| 1975 | - | 57 431 406 $ US |
| 1974 | - | 77 591 856 $ US |
| 1973 | - | 86 601 218 $ US |
| 1972 | - | 59 464 611 $ US |
| 1971 | - | 50 332 572 $ US |
| 1970 | - | 42 740 000 $ US |
| 1969 | - | 40 000 000 $ US |
| 1968 | - | 52 000 000 $ US |
| 1967 | - | 55 000 000 $ US |
| 1966 | - | 43 000 000 $ US |
| 1965 | - | 73 000 000 $ US |
| 1964 | - | 52 000 000 $ US |
| 1963 | - | 75 000 000 $ US |
| 1962 | - | 85 000 000 $ US |
| 1961 | - | 90 000 000 $ US |
| 1960 | - | 101 260 000 $ US |
Les réserves de change du Vietnam s'élevaient à 83,1 milliards de dollars (2024) et celles du Sri Lanka à 6,09 milliards de dollars (2024) : celles du Vietnam étaient 14 fois plus élevées. En 1995, les réserves du Sri Lanka étaient 1,6 fois plus élevées : 1,32 milliard de dollars pour le Vietnam et 2,11 milliards de dollars pour le Sri Lanka.
Les réserves de change du Vietnam sont supérieures à celles du Sri Lanka chaque année depuis 1999.
Vietnam vs Sri Lanka : réserves, or compris, et mois d'importations couverts
|
Vietnam
|
Sri Lanka
|
|
|---|---|---|
| Réserves, or compris | 85,6 Md $US (2025) | 6,09 Md $US (2024) |
| Mois d'importations | 2,2 (2025) | 3,3 (2024) |
| Rang mondial | 33/168 | 95/168 |
Comparer les réserves de change de 2 pays au choix
Sources :
- Banque mondiale | Économie et croissance (1960–2025, mis à jour en octobre 2026)
Creative Commons Attribution (CC BY) : vous pouvez copier, partager, adapter et réutiliser ce contenu, y compris à des fins commerciales, à condition de citer statistics.wiki et d’indiquer les modifications apportées. Les sources citées ci-dessus peuvent avoir leurs propres conditions de licence.