
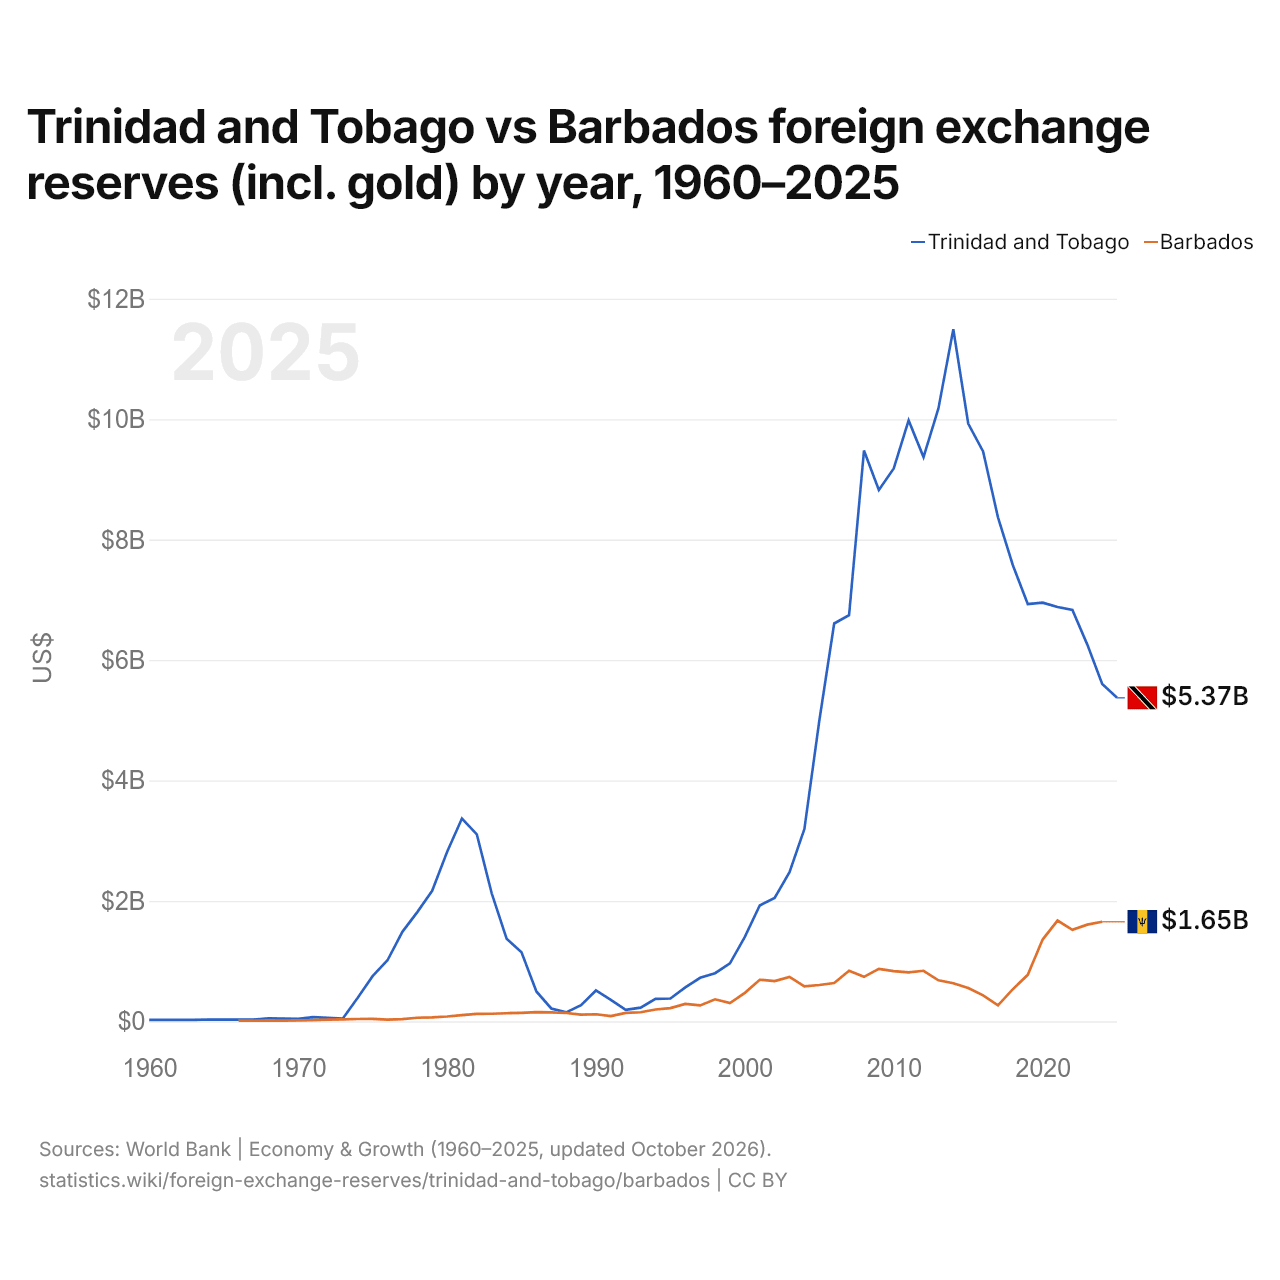
Trinité-et-Tobago vs Barbade : réserves de change (or compris) par année, 1960–2025
| Année | $ US | |
|---|---|---|
 Trinité-et-Tobago |
 Barbade |
|
| 2025 | 5 372 033 723 $ US | - |
| 2024 | 5 601 120 709 $ US | 1 653 675 115 $ US |
| 2023 | 6 255 633 382 $ US | 1 605 919 491 $ US |
| 2022 | 6 832 392 605 $ US | 1 519 660 180 $ US |
| 2021 | 6 879 594 622 $ US | 1 672 884 485 $ US |
| 2020 | 6 953 756 951 $ US | 1 358 013 876 $ US |
| 2019 | 6 928 951 714 $ US | 772 118 650 $ US |
| 2018 | 7 575 050 349 $ US | 533 906 813 $ US |
| 2017 | 8 369 757 249 $ US | 265 841 633 $ US |
| 2016 | 9 464 961 137 $ US | 431 758 242 $ US |
| 2015 | 9 927 294 619 $ US | 553 604 324 $ US |
| 2014 | 11 493 196 341 $ US | 632 258 680 $ US |
| 2013 | 10 176 864 834 $ US | 680 957 827 $ US |
| 2012 | 9 370 784 004 $ US | 839 722 748 $ US |
| 2011 | 9 980 126 114 $ US | 812 596 876 $ US |
| 2010 | 9 180 991 460 $ US | 833 540 950 $ US |
| 2009 | 8 823 426 554 $ US | 871 145 394 $ US |
| 2008 | 9 478 682 839 $ US | 738 527 015 $ US |
| 2007 | 6 745 220 698 $ US | 839 429 793 $ US |
| 2006 | 6 607 231 897 $ US | 636 089 800 $ US |
| 2005 | 4 992 257 912 $ US | 603 465 289 $ US |
| 2004 | 3 195 021 782 $ US | 579 857 104 $ US |
| 2003 | 2 476 582 262 $ US | 737 943 173 $ US |
| 2002 | 2 048 593 954 $ US | 668 514 869 $ US |
| 2001 | 1 923 855 112 $ US | 690 373 664 $ US |
| 2000 | 1 402 802 249 $ US | 472 693 479 $ US |
| 1999 | 962 755 103 $ US | 301 944 451 $ US |
| 1998 | 800 041 441 $ US | 365 945 246 $ US |
| 1997 | 723 242 005 $ US | 264 917 583 $ US |
| 1996 | 563 761 635 $ US | 289 685 886 $ US |
| 1995 | 379 080 862 $ US | 219 099 891 $ US |
| 1994 | 373 083 170 $ US | 195 765 860 $ US |
| 1993 | 228 176 389 $ US | 150 453 017 $ US |
| 1992 | 190 205 926 $ US | 139 962 501 $ US |
| 1991 | 357 676 078 $ US | 87 245 215 $ US |
| 1990 | 512 775 399 $ US | 117 535 619 $ US |
| 1989 | 268 155 349 $ US | 111 894 938 $ US |
| 1988 | 149 225 932 $ US | 137 948 752 $ US |
| 1987 | 213 910 400 $ US | 148 145 897 $ US |
| 1986 | 495 212 702 $ US | 154 080 959 $ US |
| 1985 | 1 146 123 103 $ US | 141 755 188 $ US |
| 1984 | 1 373 306 758 $ US | 134 385 155 $ US |
| 1983 | 2 125 106 351 $ US | 125 586 463 $ US |
| 1982 | 3 105 153 737 $ US | 124 370 269 $ US |
| 1981 | 3 368 927 215 $ US | 102 966 358 $ US |
| 1980 | 2 812 572 061 $ US | 80 572 815 $ US |
| 1979 | 2 167 600 504 $ US | 66 117 379 $ US |
| 1978 | 1 813 944 908 $ US | 59 836 293 $ US |
| 1977 | 1 486 150 623 $ US | 37 006 128 $ US |
| 1976 | 1 013 547 507 $ US | 27 977 462 $ US |
| 1975 | 750 953 202 $ US | 39 579 071 $ US |
| 1974 | 390 326 808 $ US | 39 152 392 $ US |
| 1973 | 47 013 306 $ US | 32 374 267 $ US |
| 1972 | 58 258 900 $ US | 27 988 872 $ US |
| 1971 | 69 382 900 $ US | 18 860 582 $ US |
| 1970 | 43 020 000 $ US | 16 580 000 $ US |
| 1969 | 44 720 000 $ US | 12 470 000 $ US |
| 1968 | 49 410 000 $ US | 15 520 000 $ US |
| 1967 | 30 300 000 $ US | 9 250 000 $ US |
| 1966 | 29 690 000 $ US | 12 110 000 $ US |
| 1965 | 28 540 000 $ US | - |
| 1964 | 29 940 000 $ US | - |
| 1963 | 24 500 000 $ US | - |
| 1962 | 23 300 000 $ US | - |
| 1961 | 26 300 000 $ US | - |
| 1960 | 23 600 000 $ US | - |
Les réserves de change de Trinité-et-Tobago s'élevaient à 5,6 milliards de dollars (2024) et celles de la Barbade à 1,65 milliard de dollars (2024) : celles de Trinité-et-Tobago étaient 3,4 fois plus élevées. En 1966, les réserves de Trinité-et-Tobago étaient 2,5 fois plus élevées : 29,7 millions de dollars pour Trinité-et-Tobago et 12,1 millions de dollars pour la Barbade.
Les réserves de change de Trinité-et-Tobago sont supérieures à celles de la Barbade chaque année depuis 1966.
Trinité-et-Tobago vs Barbade : réserves, or compris, et mois d'importations couverts
|
Trinité-et-Tobago
|
Barbade
|
|
|---|---|---|
| Réserves, or compris | 5,37 Md $US (2025) | 1,65 Md $US (2024) |
| Mois d'importations | n.d. | n.d. |
| Rang mondial | 99/168 | 127/168 |
Comparer les réserves de change de 2 pays au choix
Sources :
- Banque mondiale | Économie et croissance (1960–2025, mis à jour en octobre 2026)
Creative Commons Attribution (CC BY) : vous pouvez copier, partager, adapter et réutiliser ce contenu, y compris à des fins commerciales, à condition de citer statistics.wiki et d’indiquer les modifications apportées. Les sources citées ci-dessus peuvent avoir leurs propres conditions de licence.