
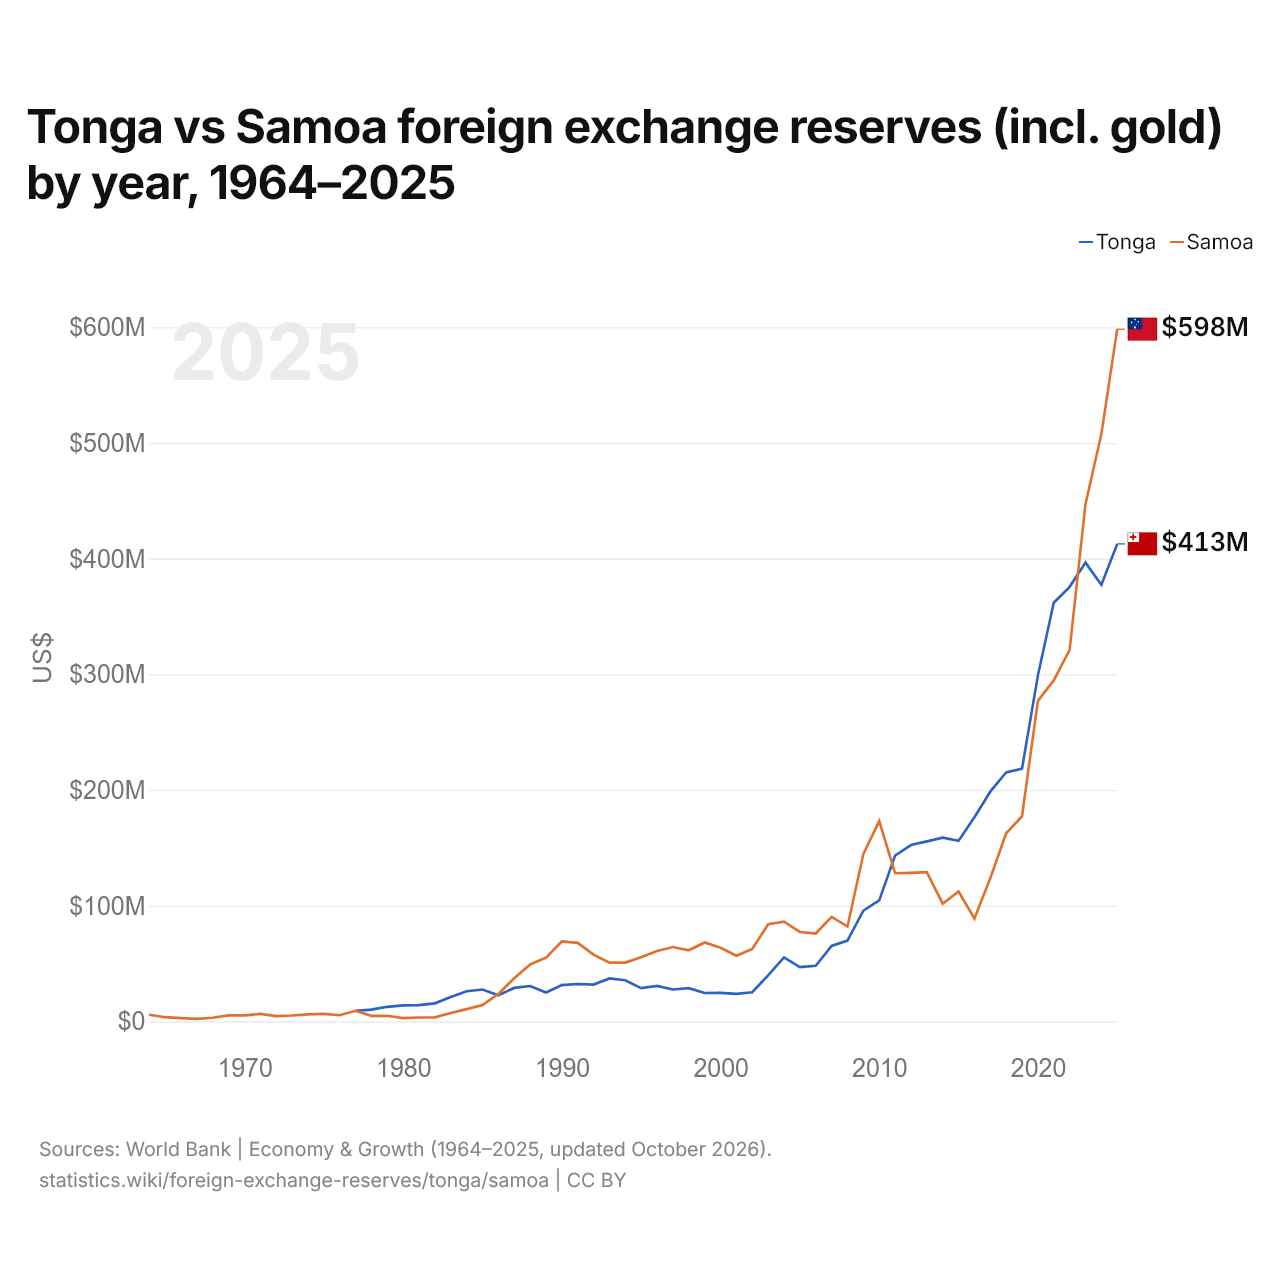
Tonga vs Samoa : réserves de change (or compris) par année, 1964–2025
| Année | $ US | |
|---|---|---|
 Tonga |
 Samoa |
|
| 2025 | 412 716 557 $ US | 598 336 708 $ US |
| 2024 | 377 298 749 $ US | 507 740 281 $ US |
| 2023 | 396 530 126 $ US | 447 089 817 $ US |
| 2022 | 375 564 013 $ US | 321 163 284 $ US |
| 2021 | 361 811 848 $ US | 294 681 800 $ US |
| 2020 | 298 947 630 $ US | 277 056 415 $ US |
| 2019 | 218 448 402 $ US | 177 244 066 $ US |
| 2018 | 215 149 319 $ US | 162 559 148 $ US |
| 2017 | 198 522 418 $ US | 123 656 063 $ US |
| 2016 | 176 497 315 $ US | 88 868 313 $ US |
| 2015 | 156 107 669 $ US | 112 244 941 $ US |
| 2014 | 158 784 814 $ US | 101 674 433 $ US |
| 2013 | 155 520 938 $ US | 128 930 589 $ US |
| 2012 | 152 403 989 $ US | 128 350 849 $ US |
| 2011 | 143 294 510 $ US | 128 020 439 $ US |
| 2010 | 104 527 451 $ US | 173 039 793 $ US |
| 2009 | 95 702 574 $ US | 144 476 858 $ US |
| 2008 | 69 753 903 $ US | 81 946 110 $ US |
| 2007 | 65 238 722 $ US | 90 264 699 $ US |
| 2006 | 47 972 474 $ US | 75 906 873 $ US |
| 2005 | 46 864 163 $ US | 77 256 901 $ US |
| 2004 | 55 262 357 $ US | 86 133 747 $ US |
| 2003 | 39 771 013 $ US | 83 909 637 $ US |
| 2002 | 25 120 531 $ US | 62 493 669 $ US |
| 2001 | 23 759 782 $ US | 56 635 260 $ US |
| 2000 | 24 642 268 $ US | 63 657 901 $ US |
| 1999 | 24 490 344 $ US | 68 199 387 $ US |
| 1998 | 28 656 376 $ US | 61 422 642 $ US |
| 1997 | 27 493 104 $ US | 64 205 877 $ US |
| 1996 | 30 615 940 $ US | 60 804 917 $ US |
| 1995 | 28 709 990 $ US | 55 312 671 $ US |
| 1994 | 35 538 621 $ US | 50 800 685 $ US |
| 1993 | 37 060 900 $ US | 50 705 976 $ US |
| 1992 | 31 769 008 $ US | 57 646 263 $ US |
| 1991 | 32 282 038 $ US | 67 807 729 $ US |
| 1990 | 31 338 618 $ US | 69 045 292 $ US |
| 1989 | 24 851 181 $ US | 55 066 198 $ US |
| 1988 | 30 509 471 $ US | 49 196 955 $ US |
| 1987 | 28 880 742 $ US | 37 198 446 $ US |
| 1986 | 22 481 861 $ US | 23 746 325 $ US |
| 1985 | 27 509 830 $ US | 14 020 984 $ US |
| 1984 | 26 017 000 $ US | 10 557 031 $ US |
| 1983 | 20 953 000 $ US | 7 229 252 $ US |
| 1982 | 15 561 000 $ US | 3 481 031 $ US |
| 1981 | 13 981 000 $ US | 3 281 640 $ US |
| 1980 | 13 753 000 $ US | 2 770 000 $ US |
| 1979 | 12 560 000 $ US | 4 820 000 $ US |
| 1978 | 10 116 000 $ US | 4 782 112 $ US |
| 1977 | 9 001 000 $ US | 9 126 441 $ US |
| 1976 | - | 5 240 000 $ US |
| 1975 | - | 6 386 826 $ US |
| 1974 | - | 5 957 879 $ US |
| 1973 | - | 5 077 617 $ US |
| 1972 | - | 4 528 859 $ US |
| 1971 | - | 6 410 858 $ US |
| 1970 | - | 5 220 000 $ US |
| 1969 | - | 5 150 000 $ US |
| 1968 | - | 3 060 000 $ US |
| 1967 | - | 2 160 000 $ US |
| 1966 | - | 2 730 000 $ US |
| 1965 | - | 3 570 000 $ US |
| 1964 | - | 5 680 000 $ US |
En 2025, les réserves de change des Tonga s'élevaient à 413 millions de dollars et celles des Samoa à 598 millions de dollars : celles des Samoa étaient supérieures de 45 %. En 1977, les réserves des Samoa étaient supérieures de 1,4 % : 9 millions de dollars pour les Tonga et 9,13 millions de dollars pour les Samoa.
Les réserves de change des Samoa sont supérieures à celles des Tonga chaque année depuis 2023.
Tonga vs Samoa : réserves, or compris, et mois d'importations couverts
Comparer les réserves de change de 2 pays au choix
Sources :
- Banque mondiale | Économie et croissance (1964–2025, mis à jour en octobre 2026)
Creative Commons Attribution (CC BY) : vous pouvez copier, partager, adapter et réutiliser ce contenu, y compris à des fins commerciales, à condition de citer statistics.wiki et d’indiquer les modifications apportées. Les sources citées ci-dessus peuvent avoir leurs propres conditions de licence.