
Espagne vs Arabie saoudite : réserves de change (or compris) par année, 1960–2025
| Année | $ US | |
|---|---|---|
 Espagne |
 Arabie saoudite |
|
| 2025 | 128 593 472 896 $ US | 505 163 993 095 $ US |
| 2024 | 107 774 143 969 $ US | 463 869 589 071 $ US |
| 2023 | 103 088 315 528 $ US | 457 948 635 287 $ US |
| 2022 | 92 905 070 060 $ US | 478 231 707 666 $ US |
| 2021 | 92 201 269 195 $ US | 473 889 603 513 $ US |
| 2020 | 81 287 702 461 $ US | 472 850 970 845 $ US |
| 2019 | 74 731 427 284 $ US | 514 962 537 825 $ US |
| 2018 | 70 633 189 428 $ US | 509 468 527 336 $ US |
| 2017 | 69 400 198 866 $ US | 509 457 096 430 $ US |
| 2016 | 63 039 926 529 $ US | 547 266 635 919 $ US |
| 2015 | 53 973 842 236 $ US | 626 989 686 478 $ US |
| 2014 | 50 411 846 512 $ US | 744 440 513 643 $ US |
| 2013 | 46 335 465 038 $ US | 737 796 355 078 $ US |
| 2012 | 50 588 475 477 $ US | 673 739 616 018 $ US |
| 2011 | 46 704 835 357 $ US | 556 570 950 256 $ US |
| 2010 | 31 871 836 373 $ US | 459 313 194 915 $ US |
| 2009 | 28 051 366 380 $ US | 420 983 696 036 $ US |
| 2008 | 20 288 388 624 $ US | 451 278 977 578 $ US |
| 2007 | 19 028 952 268 $ US | 309 287 347 097 $ US |
| 2006 | 19 339 948 067 $ US | 228 956 885 016 $ US |
| 2005 | 17 227 460 742 $ US | 157 386 678 401 $ US |
| 2004 | 19 758 627 233 $ US | 29 303 891 020 $ US |
| 2003 | 26 809 451 669 $ US | 24 537 673 815 $ US |
| 2002 | 40 303 470 181 $ US | 22 185 731 358 $ US |
| 2001 | 34 235 520 830 $ US | 18 866 525 322 $ US |
| 2000 | 35 607 623 345 $ US | 20 846 854 711 $ US |
| 1999 | 37 999 943 736 $ US | 18 330 921 206 $ US |
| 1998 | 60 881 358 763 $ US | 15 542 900 630 $ US |
| 1997 | 72 934 647 813 $ US | 16 210 181 642 $ US |
| 1996 | 63 699 008 717 $ US | 16 017 714 791 $ US |
| 1995 | 40 530 652 088 $ US | 10 399 125 055 $ US |
| 1994 | 47 531 541 940 $ US | 9 138 918 507 $ US |
| 1993 | 47 145 829 669 $ US | 9 223 544 328 $ US |
| 1992 | 50 708 513 479 $ US | 7 466 618 403 $ US |
| 1991 | 71 344 881 793 $ US | 13 298 434 204 $ US |
| 1990 | 57 238 070 968 $ US | 13 437 132 419 $ US |
| 1989 | 47 769 550 564 $ US | 18 590 557 937 $ US |
| 1988 | 42 835 075 929 $ US | 22 438 214 643 $ US |
| 1987 | 36 439 290 440 $ US | 24 909 304 908 $ US |
| 1986 | 20 548 059 804 $ US | 20 120 464 282 $ US |
| 1985 | 15 966 405 780 $ US | 26 506 763 265 $ US |
| 1984 | 16 464 821 365 $ US | 26 165 371 829 $ US |
| 1983 | 12 974 277 206 $ US | 29 040 756 673 $ US |
| 1982 | 14 328 182 502 $ US | 31 649 049 103 $ US |
| 1981 | 16 610 948 553 $ US | 34 051 190 080 $ US |
| 1980 | 20 473 495 450 $ US | 26 128 874 848 $ US |
| 1979 | 20 702 703 862 $ US | 21 611 589 271 $ US |
| 1978 | 13 394 127 225 $ US | 20 225 550 057 $ US |
| 1977 | 8 357 980 886 $ US | 30 410 993 714 $ US |
| 1976 | 6 626 926 078 $ US | 27 314 909 464 $ US |
| 1975 | 7 507 064 706 $ US | 23 625 313 525 $ US |
| 1974 | 8 535 016 961 $ US | 14 727 449 735 $ US |
| 1973 | 7 771 042 558 $ US | 4 093 816 070 $ US |
| 1972 | 5 397 172 464 $ US | 2 583 652 933 $ US |
| 1971 | 3 347 891 154 $ US | 1 462 013 713 $ US |
| 1970 | 1 851 302 470 $ US | 669 558 000 $ US |
| 1969 | 1 285 926 800 $ US | 607 180 000 $ US |
| 1968 | 1 303 543 700 $ US | 684 960 000 $ US |
| 1967 | 1 053 098 400 $ US | 761 879 200 $ US |
| 1966 | 1 210 578 030 $ US | 747 859 490 $ US |
| 1965 | 1 411 897 520 $ US | 726 260 320 $ US |
| 1964 | 1 515 235 680 $ US | 585 032 480 $ US |
| 1963 | 1 148 505 160 $ US | 513 943 320 $ US |
| 1962 | 1 045 887 990 $ US | 267 921 030 $ US |
| 1961 | 887 873 550 $ US | 238 033 550 $ US |
| 1960 | 544 061 600 $ US | 185 058 400 $ US |
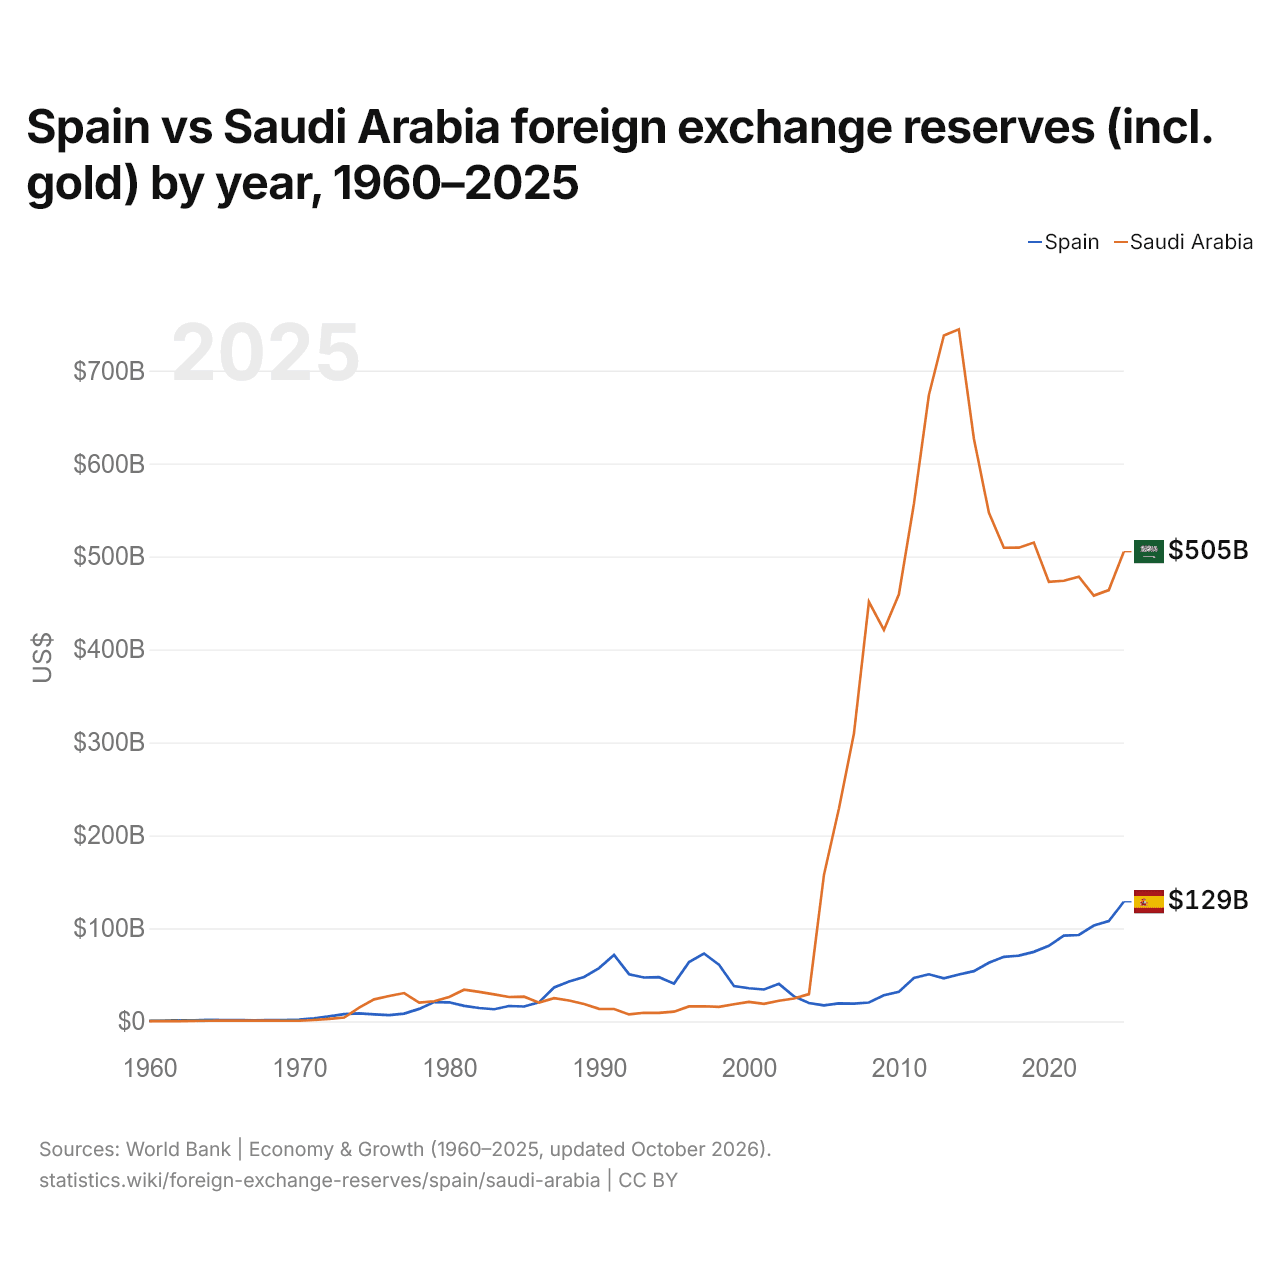
En 2025, les réserves de change de l'Espagne s'élevaient à 129 milliards de dollars et celles de l'Arabie saoudite à 505 milliards de dollars : celles de l'Arabie saoudite étaient 3,9 fois plus élevées. En 1960, les réserves de l'Espagne étaient 2,9 fois plus élevées : 544 millions de dollars pour l'Espagne et 185 millions de dollars pour l'Arabie saoudite.
Les réserves de change de l'Arabie saoudite sont supérieures à celles de l'Espagne chaque année depuis 2004.
Espagne vs Arabie saoudite : réserves, or compris, et mois d'importations couverts
|
Espagne
|
Arabie saoudite
|
|
|---|---|---|
| Réserves, or compris | 129 Md $US | 505 Md $US |
| Mois d'importations | 2,5 | 16,9 |
| Rang mondial | 23/168 | 8/168 |
| Écart des réserves | 0,25× | 3,9× |
Comparer les réserves de change de 2 pays au choix
Sources :
- Banque mondiale | Économie et croissance (1960–2025, mis à jour en octobre 2026)
Creative Commons Attribution (CC BY) : vous pouvez copier, partager, adapter et réutiliser ce contenu, y compris à des fins commerciales, à condition de citer statistics.wiki et d’indiquer les modifications apportées. Les sources citées ci-dessus peuvent avoir leurs propres conditions de licence.