
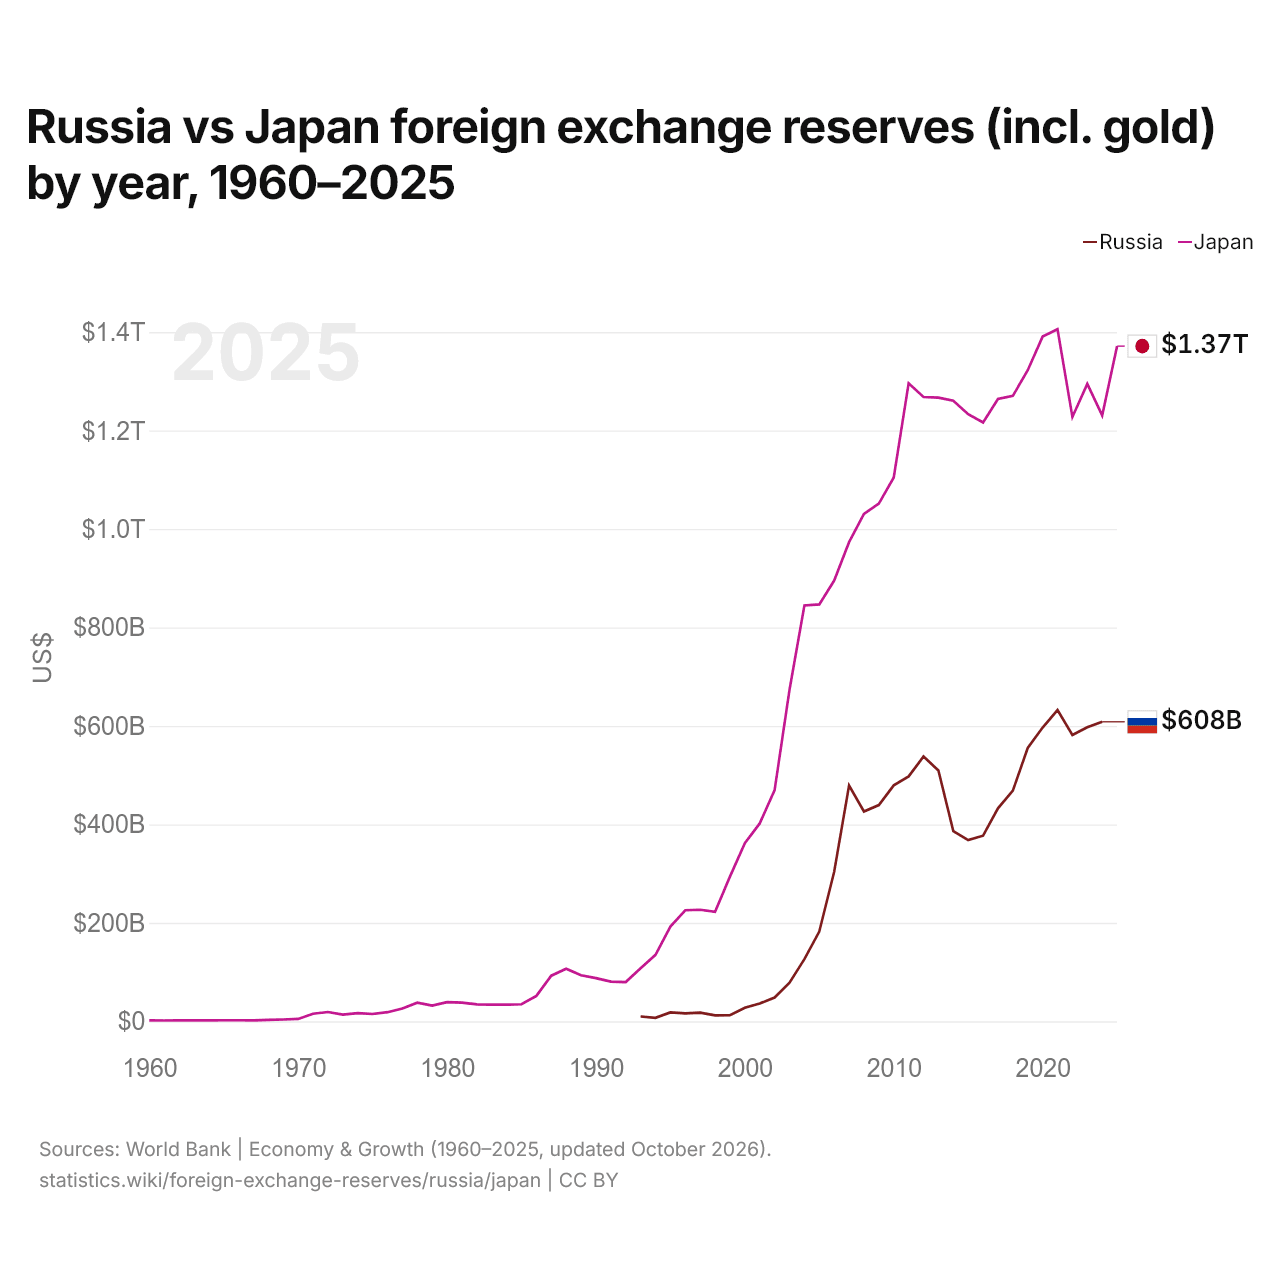
Russie vs Japon : réserves de change (or compris) par année, 1960–2025
| Année | $ US | |
|---|---|---|
 Russie |
 Japon |
|
| 2025 | - | 1 371 402 218 768 $ US |
| 2024 | 608 360 767 885 $ US | 1 230 666 979 042 $ US |
| 2023 | 597 217 063 819 $ US | 1 294 636 035 264 $ US |
| 2022 | 581 709 956 946 $ US | 1 227 573 263 129 $ US |
| 2021 | 632 241 824 796 $ US | 1 405 748 991 419 $ US |
| 2020 | 596 769 862 770 $ US | 1 390 808 939 303 $ US |
| 2019 | 555 179 461 639 $ US | 1 322 443 255 599 $ US |
| 2018 | 468 645 216 083 $ US | 1 270 467 038 787 $ US |
| 2017 | 432 730 507 964 $ US | 1 264 140 980 384 $ US |
| 2016 | 377 052 204 308 $ US | 1 216 518 779 920 $ US |
| 2015 | 368 042 950 259 $ US | 1 233 097 790 282 $ US |
| 2014 | 386 216 337 149 $ US | 1 260 680 310 063 $ US |
| 2013 | 509 692 074 389 $ US | 1 266 851 401 020 $ US |
| 2012 | 537 816 372 807 $ US | 1 268 085 524 238 $ US |
| 2011 | 497 410 212 789 $ US | 1 295 838 676 317 $ US |
| 2010 | 479 222 324 221 $ US | 1 104 563 760 972 $ US |
| 2009 | 439 341 754 765 $ US | 1 051 654 952 502 $ US |
| 2008 | 426 278 773 722 $ US | 1 030 762 755 205 $ US |
| 2007 | 478 822 286 132 $ US | 973 296 740 493 $ US |
| 2006 | 303 773 185 900 $ US | 895 321 278 050 $ US |
| 2005 | 182 272 103 918 $ US | 846 895 906 145 $ US |
| 2004 | 126 257 956 296 $ US | 844 667 163 385 $ US |
| 2003 | 78 409 347 971 $ US | 673 554 461 759 $ US |
| 2002 | 48 325 637 167 $ US | 469 618 129 428 $ US |
| 2001 | 36 302 524 269 $ US | 401 957 624 245 $ US |
| 2000 | 27 656 266 696 $ US | 361 639 097 012 $ US |
| 1999 | 12 325 102 379 $ US | 293 948 150 986 $ US |
| 1998 | 12 042 972 908 $ US | 222 443 261 241 $ US |
| 1997 | 17 624 090 270 $ US | 226 679 071 030 $ US |
| 1996 | 16 257 617 319 $ US | 225 593 968 190 $ US |
| 1995 | 18 023 640 710 $ US | 192 619 707 815 $ US |
| 1994 | 7 206 227 228 $ US | 135 145 568 171 $ US |
| 1993 | 9 817 681 551 $ US | 107 988 991 686 $ US |
| 1992 | - | 79 696 681 098 $ US |
| 1991 | - | 80 625 862 247 $ US |
| 1990 | - | 87 828 344 748 $ US |
| 1989 | - | 93 672 792 067 $ US |
| 1988 | - | 106 667 696 598 $ US |
| 1987 | - | 92 701 644 566 $ US |
| 1986 | - | 51 727 340 940 $ US |
| 1985 | - | 34 641 191 189 $ US |
| 1984 | - | 33 898 635 723 $ US |
| 1983 | - | 33 844 570 859 $ US |
| 1982 | - | 34 403 722 657 $ US |
| 1981 | - | 37 839 021 738 $ US |
| 1980 | - | 38 918 853 640 $ US |
| 1979 | - | 31 926 247 771 $ US |
| 1978 | - | 37 824 760 300 $ US |
| 1977 | - | 25 907 718 768 $ US |
| 1976 | - | 18 590 786 441 $ US |
| 1975 | - | 14 910 844 574 $ US |
| 1974 | - | 16 551 249 546 $ US |
| 1973 | - | 13 723 926 171 $ US |
| 1972 | - | 18 932 680 017 $ US |
| 1971 | - | 15 469 152 225 $ US |
| 1970 | - | 4 876 114 550 $ US |
| 1969 | - | 3 656 226 000 $ US |
| 1968 | - | 2 976 246 800 $ US |
| 1967 | - | 2 032 436 400 $ US |
| 1966 | - | 2 121 519 420 $ US |
| 1965 | - | 2 153 610 240 $ US |
| 1964 | - | 2 020 624 000 $ US |
| 1963 | - | 2 059 016 360 $ US |
| 1962 | - | 2 021 337 500 $ US |
| 1961 | - | 1 667 124 550 $ US |
| 1960 | - | 1 953 371 600 $ US |
Les réserves de change de la Russie s'élevaient à 608 milliards de dollars (2024) et celles du Japon à 1,23 billion de dollars (2024) : celles du Japon étaient 2,0 fois plus élevées. En 1993, les réserves du Japon étaient 11 fois plus élevées : 9,82 milliards de dollars pour la Russie et 108 milliards de dollars pour le Japon.
Les réserves de change du Japon sont supérieures à celles de la Russie chaque année depuis 1993.
Russie vs Japon : réserves, or compris, et mois d'importations couverts
|
Russie
|
Japon
|
|
|---|---|---|
| Réserves, or compris | 608 Md $US (2024) | 1,37 Bn $US (2025) |
| Mois d'importations | 19,0 (2024) | 16,5 (2025) |
| Rang mondial | 6/168 | 3/168 |
Comparer les réserves de change de 2 pays au choix
Sources :
- Banque mondiale | Économie et croissance (1960–2025, mis à jour en octobre 2026)
Creative Commons Attribution (CC BY) : vous pouvez copier, partager, adapter et réutiliser ce contenu, y compris à des fins commerciales, à condition de citer statistics.wiki et d’indiquer les modifications apportées. Les sources citées ci-dessus peuvent avoir leurs propres conditions de licence.