
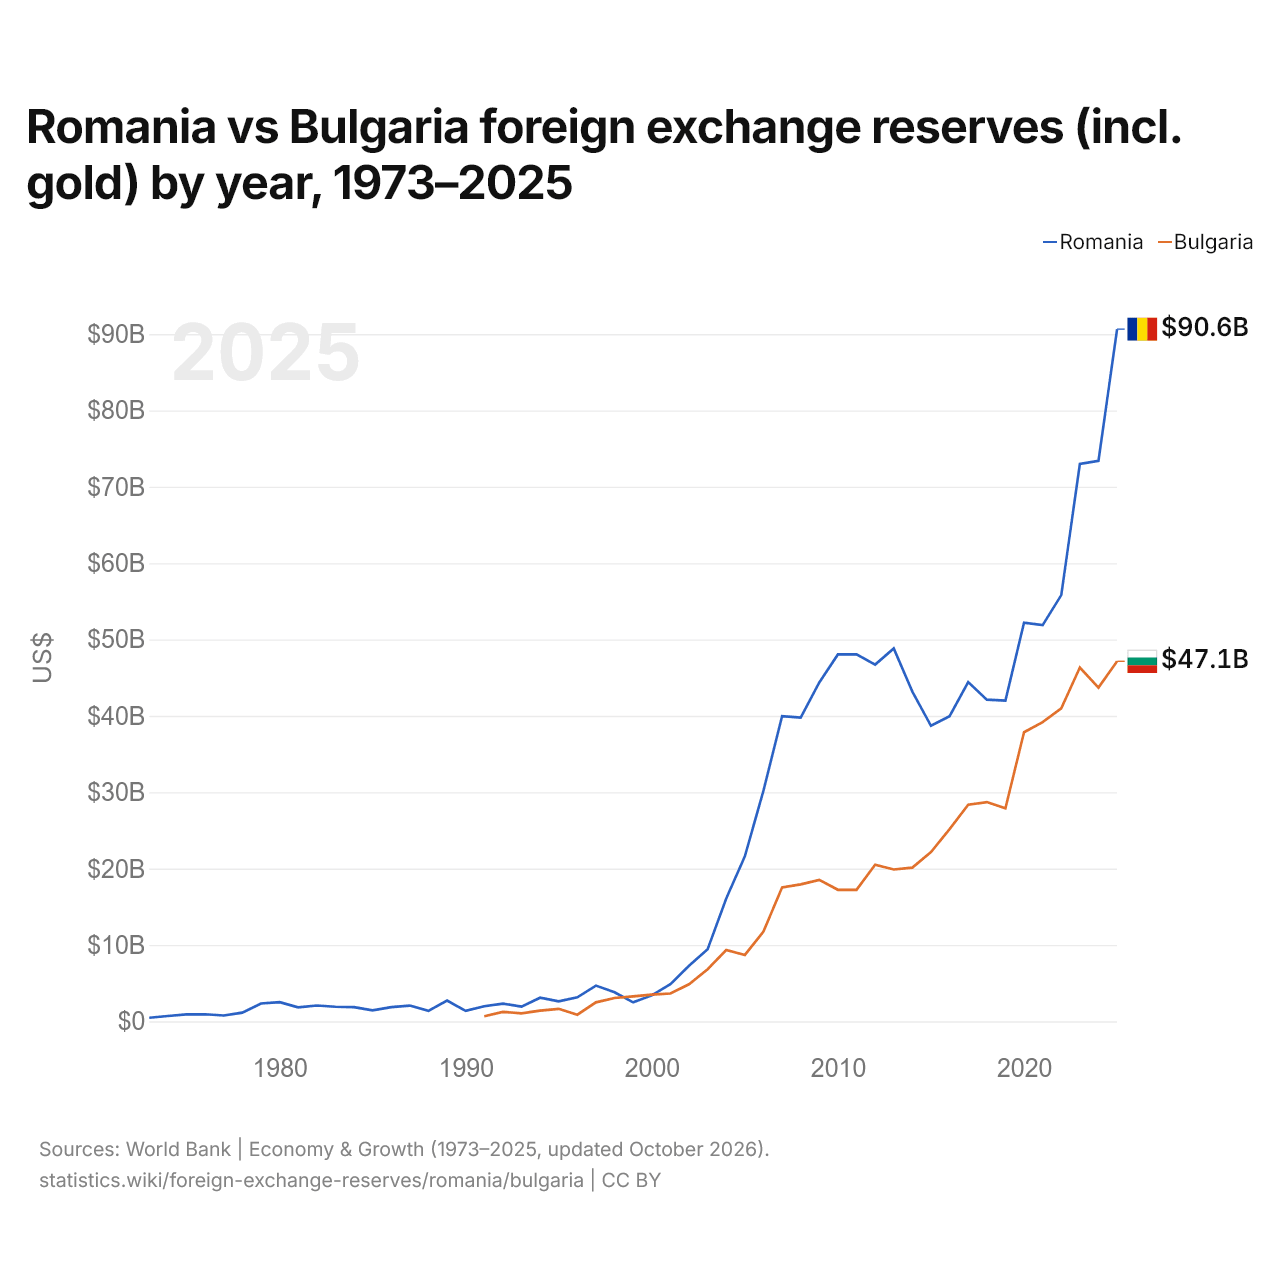
Roumanie vs Bulgarie : réserves de change (or compris) par année, 1973–2025
| Année | $ US | |
|---|---|---|
 Roumanie |
 Bulgarie |
|
| 2025 | 90 648 371 895 $ US | 47 145 331 736 $ US |
| 2024 | 73 391 248 091 $ US | 43 698 277 896 $ US |
| 2023 | 72 999 646 522 $ US | 46 333 887 862 $ US |
| 2022 | 55 810 109 299 $ US | 40 989 114 450 $ US |
| 2021 | 51 885 588 481 $ US | 39 187 742 752 $ US |
| 2020 | 52 190 562 712 $ US | 37 860 001 349 $ US |
| 2019 | 42 006 529 634 $ US | 27 901 750 799 $ US |
| 2018 | 42 129 061 938 $ US | 28 711 039 865 $ US |
| 2017 | 44 429 296 937 $ US | 28 375 830 876 $ US |
| 2016 | 39 953 479 393 $ US | 25 176 065 816 $ US |
| 2015 | 38 700 983 241 $ US | 22 153 050 489 $ US |
| 2014 | 43 186 336 128 $ US | 20 129 698 078 $ US |
| 2013 | 48 827 640 846 $ US | 19 883 353 048 $ US |
| 2012 | 46 711 176 510 $ US | 20 507 099 695 $ US |
| 2011 | 48 044 368 559 $ US | 17 215 731 650 $ US |
| 2010 | 48 047 830 953 $ US | 17 223 204 559 $ US |
| 2009 | 44 383 053 890 $ US | 18 522 121 029 $ US |
| 2008 | 39 768 375 684 $ US | 17 930 378 434 $ US |
| 2007 | 39 974 195 969 $ US | 17 544 560 020 $ US |
| 2006 | 30 206 004 059 $ US | 11 756 001 867 $ US |
| 2005 | 21 601 177 535 $ US | 8 697 081 082 $ US |
| 2004 | 16 095 478 768 $ US | 9 337 108 133 $ US |
| 2003 | 9 449 445 049 $ US | 6 825 720 113 $ US |
| 2002 | 7 285 846 580 $ US | 4 846 429 934 $ US |
| 2001 | 4 857 637 361 $ US | 3 646 131 848 $ US |
| 2000 | 3 395 672 575 $ US | 3 507 198 891 $ US |
| 1999 | 2 490 772 933 $ US | 3 264 673 603 $ US |
| 1998 | 3 795 239 427 $ US | 3 056 953 866 $ US |
| 1997 | 4 679 435 903 $ US | 2 485 359 968 $ US |
| 1996 | 3 143 305 778 $ US | 864 262 294 $ US |
| 1995 | 2 624 348 054 $ US | 1 635 187 896 $ US |
| 1994 | 3 092 362 867 $ US | 1 396 927 155 $ US |
| 1993 | 1 921 318 131 $ US | 1 052 450 306 $ US |
| 1992 | 2 324 630 291 $ US | 1 241 109 201 $ US |
| 1991 | 1 969 442 786 $ US | 670 207 830 $ US |
| 1990 | 1 374 053 813 $ US | - |
| 1989 | 2 730 584 760 $ US | - |
| 1988 | 1 374 492 621 $ US | - |
| 1987 | 2 062 340 773 $ US | - |
| 1986 | 1 851 399 084 $ US | - |
| 1985 | 1 447 486 000 $ US | - |
| 1984 | 1 859 571 165 $ US | - |
| 1983 | 1 906 207 983 $ US | - |
| 1982 | 2 073 349 275 $ US | - |
| 1981 | 1 830 923 001 $ US | - |
| 1980 | 2 511 224 000 $ US | - |
| 1979 | 2 334 697 226 $ US | - |
| 1978 | 1 132 422 000 $ US | - |
| 1977 | 760 585 078 $ US | - |
| 1976 | 932 008 735 $ US | - |
| 1975 | 903 723 291 $ US | - |
| 1974 | 696 928 015 $ US | - |
| 1973 | 470 558 568 $ US | - |
En 2025, les réserves de change de la Roumanie s'élevaient à 90,6 milliards de dollars et celles de la Bulgarie à 47,1 milliards de dollars : celles de la Roumanie étaient 1,9 fois plus élevées. En 1991, les réserves de la Roumanie étaient 2,9 fois plus élevées : 1,97 milliard de dollars pour la Roumanie et 670 millions de dollars pour la Bulgarie.
Les réserves de change de la Roumanie sont supérieures à celles de la Bulgarie chaque année depuis 2001.
Roumanie vs Bulgarie : réserves, or compris, et mois d'importations couverts
|
Roumanie
|
Bulgarie
|
|
|---|---|---|
| Réserves, or compris | 90,6 Md $US | 47,1 Md $US |
| Mois d'importations | 6,2 | 8,4 |
| Rang mondial | 31/168 | 52/168 |
| Écart des réserves | 1,9× | 0,52× |
Comparer les réserves de change de 2 pays au choix
Sources :
- Banque mondiale | Économie et croissance (1973–2025, mis à jour en octobre 2026)
Creative Commons Attribution (CC BY) : vous pouvez copier, partager, adapter et réutiliser ce contenu, y compris à des fins commerciales, à condition de citer statistics.wiki et d’indiquer les modifications apportées. Les sources citées ci-dessus peuvent avoir leurs propres conditions de licence.