
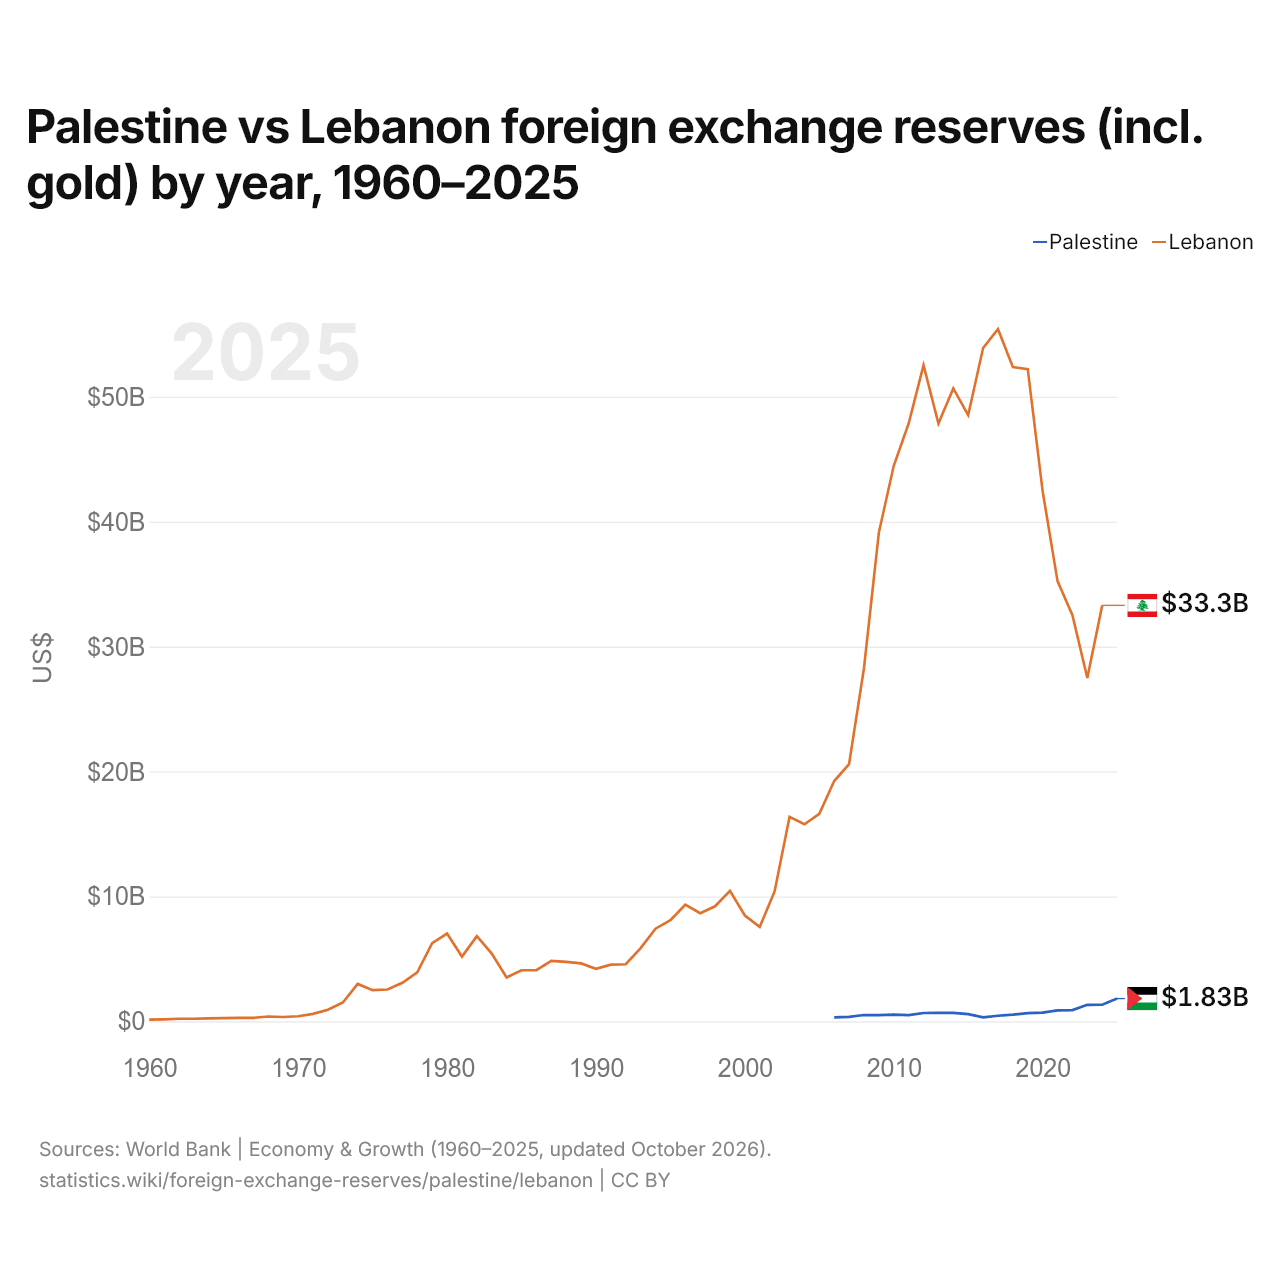
Palestine vs Liban : réserves de change (or compris) par année, 1960–2025
| Année | $ US | |
|---|---|---|
 Palestine |
 Liban |
|
| 2025 | 1 825 200 000 $ US | - |
| 2024 | 1 328 000 000 $ US | 33 301 277 510 $ US |
| 2023 | 1 323 200 000 $ US | 27 489 698 131 $ US |
| 2022 | 896 900 000 $ US | 32 512 880 022 $ US |
| 2021 | 872 540 971 $ US | 35 239 219 336 $ US |
| 2020 | 697 074 683 $ US | 42 440 403 087 $ US |
| 2019 | 658 352 116 $ US | 52 213 484 574 $ US |
| 2018 | 537 846 125 $ US | 52 380 608 542 $ US |
| 2017 | 446 349 334 $ US | 55 411 532 096 $ US |
| 2016 | 312 800 334 $ US | 53 905 512 886 $ US |
| 2015 | 580 939 642 $ US | 48 531 390 537 $ US |
| 2014 | 672 378 109 $ US | 50 668 863 617 $ US |
| 2013 | 685 224 934 $ US | 47 855 927 548 $ US |
| 2012 | 664 041 720 $ US | 52 530 986 899 $ US |
| 2011 | 498 047 448 $ US | 47 859 468 419 $ US |
| 2010 | 531 755 697 $ US | 44 475 631 355 $ US |
| 2009 | 498 173 298 $ US | 39 131 823 321 $ US |
| 2008 | 509 535 839 $ US | 28 265 312 110 $ US |
| 2007 | 354 784 634 $ US | 20 598 783 915 $ US |
| 2006 | 314 081 278 $ US | 19 238 867 061 $ US |
| 2005 | - | 16 617 970 571 $ US |
| 2004 | - | 15 773 807 067 $ US |
| 2003 | - | 16 367 322 525 $ US |
| 2002 | - | 10 404 665 642 $ US |
| 2001 | - | 7 563 692 927 $ US |
| 2000 | - | 8 474 638 463 $ US |
| 1999 | - | 10 452 318 025 $ US |
| 1998 | - | 9 210 344 448 $ US |
| 1997 | - | 8 652 574 859 $ US |
| 1996 | - | 9 337 093 844 $ US |
| 1995 | - | 8 099 940 555 $ US |
| 1994 | - | 7 418 500 691 $ US |
| 1993 | - | 5 862 881 281 $ US |
| 1992 | - | 4 569 657 896 $ US |
| 1991 | - | 4 536 363 880 $ US |
| 1990 | - | 4 210 389 197 $ US |
| 1989 | - | 4 636 190 478 $ US |
| 1988 | - | 4 761 143 788 $ US |
| 1987 | - | 4 832 307 036 $ US |
| 1986 | - | 4 092 905 137 $ US |
| 1985 | - | 4 089 410 432 $ US |
| 1984 | - | 3 514 703 718 $ US |
| 1983 | - | 5 420 707 181 $ US |
| 1982 | - | 6 821 644 188 $ US |
| 1981 | - | 5 182 114 835 $ US |
| 1980 | - | 7 024 574 525 $ US |
| 1979 | - | 6 253 129 756 $ US |
| 1978 | - | 3 918 138 374 $ US |
| 1977 | - | 3 089 266 498 $ US |
| 1976 | - | 2 544 358 608 $ US |
| 1975 | - | 2 494 061 145 $ US |
| 1974 | - | 2 997 376 774 $ US |
| 1973 | - | 1 507 046 654 $ US |
| 1972 | - | 922 647 621 $ US |
| 1971 | - | 598 829 651 $ US |
| 1970 | - | 404 917 180 $ US |
| 1969 | - | 348 892 800 $ US |
| 1968 | - | 388 526 600 $ US |
| 1967 | - | 282 162 800 $ US |
| 1966 | - | 282 747 660 $ US |
| 1965 | - | 251 644 720 $ US |
| 1964 | - | 233 028 080 $ US |
| 1963 | - | 206 512 480 $ US |
| 1962 | - | 206 563 420 $ US |
| 1961 | - | 161 550 900 $ US |
| 1960 | - | 140 193 600 $ US |
Les réserves de change de la Palestine s'élevaient à 1,33 milliard de dollars (2024) et celles du Liban à 33,3 milliards de dollars (2024) : celles du Liban étaient 25 fois plus élevées. En 2006, les réserves du Liban étaient 61 fois plus élevées : 314 millions de dollars pour la Palestine et 19,2 milliards de dollars pour le Liban.
Les réserves de change du Liban sont supérieures à celles de la Palestine chaque année depuis 2006.
Palestine vs Liban : réserves, or compris, et mois d'importations couverts
|
Palestine
|
Liban
|
|
|---|---|---|
| Réserves, or compris | 1,83 Md $US (2025) | 33,3 Md $US (2024) |
| Mois d'importations | 2,4 (2025) | 26,1 (2024) |
| Rang mondial | 125/168 | 56/168 |
Comparer les réserves de change de 2 pays au choix
Sources :
- Banque mondiale | Économie et croissance (1960–2025, mis à jour en octobre 2026)
Creative Commons Attribution (CC BY) : vous pouvez copier, partager, adapter et réutiliser ce contenu, y compris à des fins commerciales, à condition de citer statistics.wiki et d’indiquer les modifications apportées. Les sources citées ci-dessus peuvent avoir leurs propres conditions de licence.