
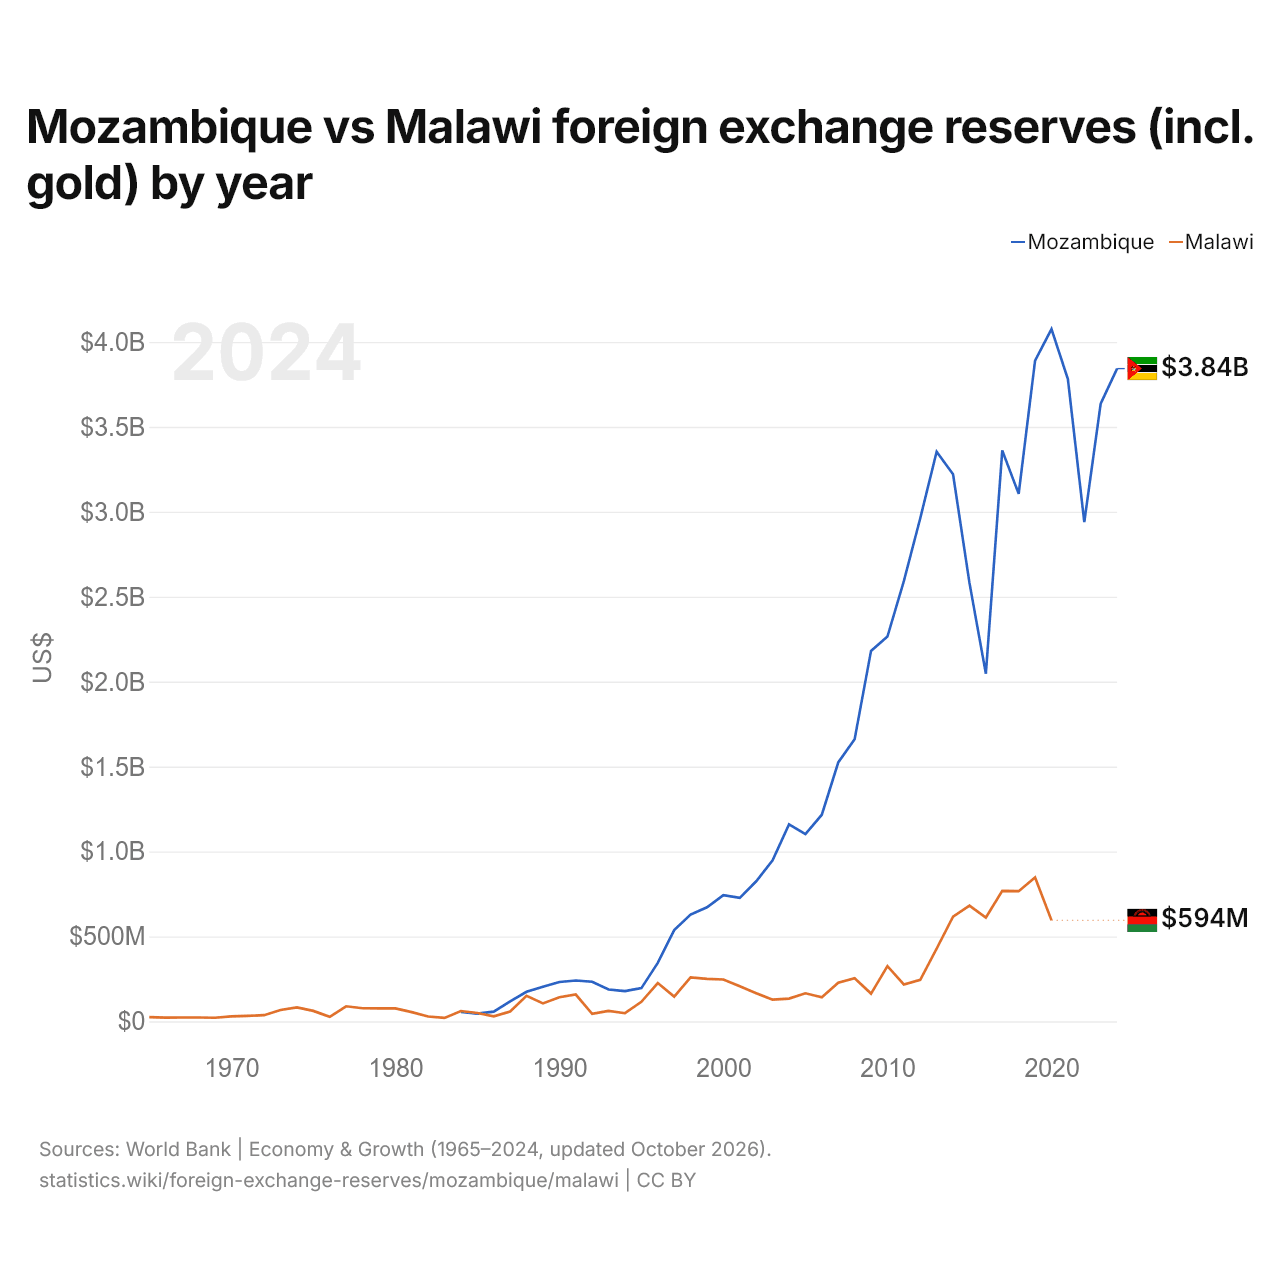
Mozambique vs Malawi : réserves de change (or compris) par année
1x
| Année | $ US | |
|---|---|---|
 Mozambique |
 Malawi |
|
| 2024 | 3 842 807 101 $ US | - |
| 2023 | 3 637 000 552 $ US | - |
| 2022 | 2 938 739 968 $ US | - |
| 2021 | 3 780 829 522 $ US | - |
| 2020 | 4 075 392 951 $ US | 594 498 494 $ US |
| 2019 | 3 889 883 055 $ US | 846 839 844 $ US |
| 2018 | 3 105 757 332 $ US | 766 154 762 $ US |
| 2017 | 3 361 224 769 $ US | 768 401 046 $ US |
| 2016 | 2 046 671 564 $ US | 610 774 218 $ US |
| 2015 | 2 581 229 792 $ US | 681 580 478 $ US |
| 2014 | 3 221 260 727 $ US | 616 100 760 $ US |
| 2013 | 3 353 349 472 $ US | 428 566 508 $ US |
| 2012 | 2 961 916 696 $ US | 244 599 528 $ US |
| 2011 | 2 591 541 583 $ US | 217 026 444 $ US |
| 2010 | 2 265 088 388 $ US | 325 348 539 $ US |
| 2009 | 2 181 058 183 $ US | 163 276 595 $ US |
| 2008 | 1 660 542 080 $ US | 253 908 649 $ US |
| 2007 | 1 524 073 650 $ US | 227 314 280 $ US |
| 2006 | 1 216 256 986 $ US | 141 932 273 $ US |
| 2005 | 1 102 663 443 $ US | 165 231 252 $ US |
| 2004 | 1 159 312 550 $ US | 133 673 449 $ US |
| 2003 | 947 825 069 $ US | 127 393 413 $ US |
| 2002 | 824 689 975 $ US | 165 874 400 $ US |
| 2001 | 726 979 119 $ US | 206 054 633 $ US |
| 2000 | 742 321 151 $ US | 246 503 871 $ US |
| 1999 | 671 348 917 $ US | 250 151 587 $ US |
| 1998 | 628 447 254 $ US | 259 135 384 $ US |
| 1997 | 537 469 867 $ US | 145 904 847 $ US |
| 1996 | 344 062 455 $ US | 225 277 396 $ US |
| 1995 | 195 318 936 $ US | 114 971 822 $ US |
| 1994 | 177 505 721 $ US | 47 716 452 $ US |
| 1993 | 187 240 822 $ US | 61 890 326 $ US |
| 1992 | 233 365 000 $ US | 44 227 442 $ US |
| 1991 | 240 557 217 $ US | 157 742 198 $ US |
| 1990 | 231 744 264 $ US | 142 103 070 $ US |
| 1989 | 203 495 525 $ US | 105 459 906 $ US |
| 1988 | 173 596 743 $ US | 150 839 666 $ US |
| 1987 | 118 022 758 $ US | 58 045 446 $ US |
| 1986 | 56 746 936 $ US | 29 621 599 $ US |
| 1985 | 45 886 268 $ US | 49 146 188 $ US |
| 1984 | 55 294 037 $ US | 60 557 705 $ US |
| 1983 | - | 20 298 653 $ US |
| 1982 | - | 28 526 412 $ US |
| 1981 | - | 54 157 160 $ US |
| 1980 | - | 75 955 674 $ US |
| 1979 | - | 76 080 407 $ US |
| 1978 | - | 76 971 900 $ US |
| 1977 | - | 88 549 587 $ US |
| 1976 | - | 26 217 494 $ US |
| 1975 | - | 61 458 203 $ US |
| 1974 | - | 81 791 078 $ US |
| 1973 | - | 66 642 984 $ US |
| 1972 | - | 36 237 163 $ US |
| 1971 | - | 31 920 015 $ US |
| 1970 | - | 29 200 000 $ US |
| 1969 | - | 21 010 000 $ US |
| 1968 | - | 22 510 000 $ US |
| 1967 | - | 22 500 000 $ US |
| 1966 | - | 21 410 000 $ US |
| 1965 | - | 25 227 000 $ US |
Les réserves de change du Mozambique s'élèvent à 3,84 milliards de dollars (2024), et celles du Malawi à 594 millions de dollars (2020). En 1984, les réserves du Malawi étaient supérieures de 9,5 % : 55,3 millions de dollars pour le Mozambique et 60,6 millions de dollars pour le Malawi.
Les réserves de change du Mozambique sont supérieures à celles du Malawi chaque année depuis 1986.
Mozambique vs Malawi : réserves, or compris, et mois d'importations couverts
|
Mozambique
|
Malawi
|
|
|---|---|---|
| Réserves, or compris | 3,84 Md $US (2024) | 594 M $US (2020) |
| Mois d'importations | 3,8 (2024) | 2,0 (2020) |
| Rang mondial | 108/168 | 149/168 |
Comparer les réserves de change de 2 pays au choix
Sources :
- Banque mondiale | Économie et croissance (1965–2024, mis à jour en octobre 2026)
Creative Commons Attribution (CC BY) : vous pouvez copier, partager, adapter et réutiliser ce contenu, y compris à des fins commerciales, à condition de citer statistics.wiki et d’indiquer les modifications apportées. Les sources citées ci-dessus peuvent avoir leurs propres conditions de licence.