
Maroc vs Kazakhstan : réserves de change (or compris) par année, 1960–2025
1x
| Année | $ US | |
|---|---|---|
 Maroc |
 Kazakhstan |
|
| 2025 | 48 453 629 605 $ US | 66 068 640 110 $ US |
| 2024 | 37 133 907 723 $ US | 45 807 523 139 $ US |
| 2023 | 36 327 701 788 $ US | 35 964 591 354 $ US |
| 2022 | 32 314 245 660 $ US | 35 076 053 023 $ US |
| 2021 | 35 648 269 520 $ US | 34 377 998 806 $ US |
| 2020 | 35 997 639 773 $ US | 35 638 096 635 $ US |
| 2019 | 26 412 762 237 $ US | 28 957 509 931 $ US |
| 2018 | 24 461 023 093 $ US | 30 976 612 439 $ US |
| 2017 | 26 189 585 939 $ US | 30 746 770 568 $ US |
| 2016 | 25 096 263 444 $ US | 29 603 056 785 $ US |
| 2015 | 22 749 566 244 $ US | 27 854 795 819 $ US |
| 2014 | 20 272 045 639 $ US | 29 250 310 668 $ US |
| 2013 | 18 797 794 940 $ US | 24 691 645 318 $ US |
| 2012 | 17 138 210 439 $ US | 28 299 368 221 $ US |
| 2011 | 20 167 412 692 $ US | 29 215 275 561 $ US |
| 2010 | 23 709 466 594 $ US | 28 264 709 323 $ US |
| 2009 | 23 568 387 093 $ US | 23 183 086 501 $ US |
| 2008 | 22 719 558 204 $ US | 19 883 105 671 $ US |
| 2007 | 24 713 570 214 $ US | 17 641 023 630 $ US |
| 2006 | 20 790 794 061 $ US | 19 127 059 972 $ US |
| 2005 | 16 550 639 874 $ US | 7 069 707 374 $ US |
| 2004 | 16 646 737 349 $ US | 9 276 665 297 $ US |
| 2003 | 14 146 568 781 $ US | 4 962 118 090 $ US |
| 2002 | 10 375 315 952 $ US | 3 140 845 035 $ US |
| 2001 | 8 669 348 377 $ US | 2 505 883 853 $ US |
| 2000 | 5 016 934 755 $ US | 2 098 969 799 $ US |
| 1999 | 5 893 811 631 $ US | 2 000 928 642 $ US |
| 1998 | 4 637 702 510 $ US | 1 965 445 686 $ US |
| 1997 | 4 197 122 871 $ US | 2 222 793 380 $ US |
| 1996 | 4 054 079 031 $ US | 1 960 072 974 $ US |
| 1995 | 3 873 508 557 $ US | 1 659 893 119 $ US |
| 1994 | 4 621 504 414 $ US | 1 216 175 913 $ US |
| 1993 | 3 929 934 565 $ US | 711 198 429 $ US |
| 1992 | 3 818 642 196 $ US | - |
| 1991 | 3 349 097 140 $ US | - |
| 1990 | 2 337 533 790 $ US | - |
| 1989 | 770 803 382 $ US | - |
| 1988 | 836 286 994 $ US | - |
| 1987 | 751 948 890 $ US | - |
| 1986 | 486 544 572 $ US | - |
| 1985 | 345 295 873 $ US | - |
| 1984 | 265 729 347 $ US | - |
| 1983 | 375 256 521 $ US | - |
| 1982 | 539 242 247 $ US | - |
| 1981 | 509 516 095 $ US | - |
| 1980 | 813 620 198 $ US | - |
| 1979 | 917 484 622 $ US | - |
| 1978 | 772 082 199 $ US | - |
| 1977 | 609 585 604 $ US | - |
| 1976 | 549 011 048 $ US | - |
| 1975 | 437 657 147 $ US | - |
| 1974 | 504 349 099 $ US | - |
| 1973 | 307 947 925 $ US | - |
| 1972 | 252 590 996 $ US | - |
| 1971 | 176 838 008 $ US | - |
| 1970 | 141 722 000 $ US | - |
| 1969 | 114 120 000 $ US | - |
| 1968 | 89 140 000 $ US | - |
| 1967 | 75 720 000 $ US | - |
| 1966 | 86 814 000 $ US | - |
| 1965 | 98 872 000 $ US | - |
| 1964 | 53 111 520 $ US | - |
| 1963 | 110 211 320 $ US | - |
| 1962 | 174 203 030 $ US | - |
| 1961 | 185 269 350 $ US | - |
| 1960 | 206 112 400 $ US | - |
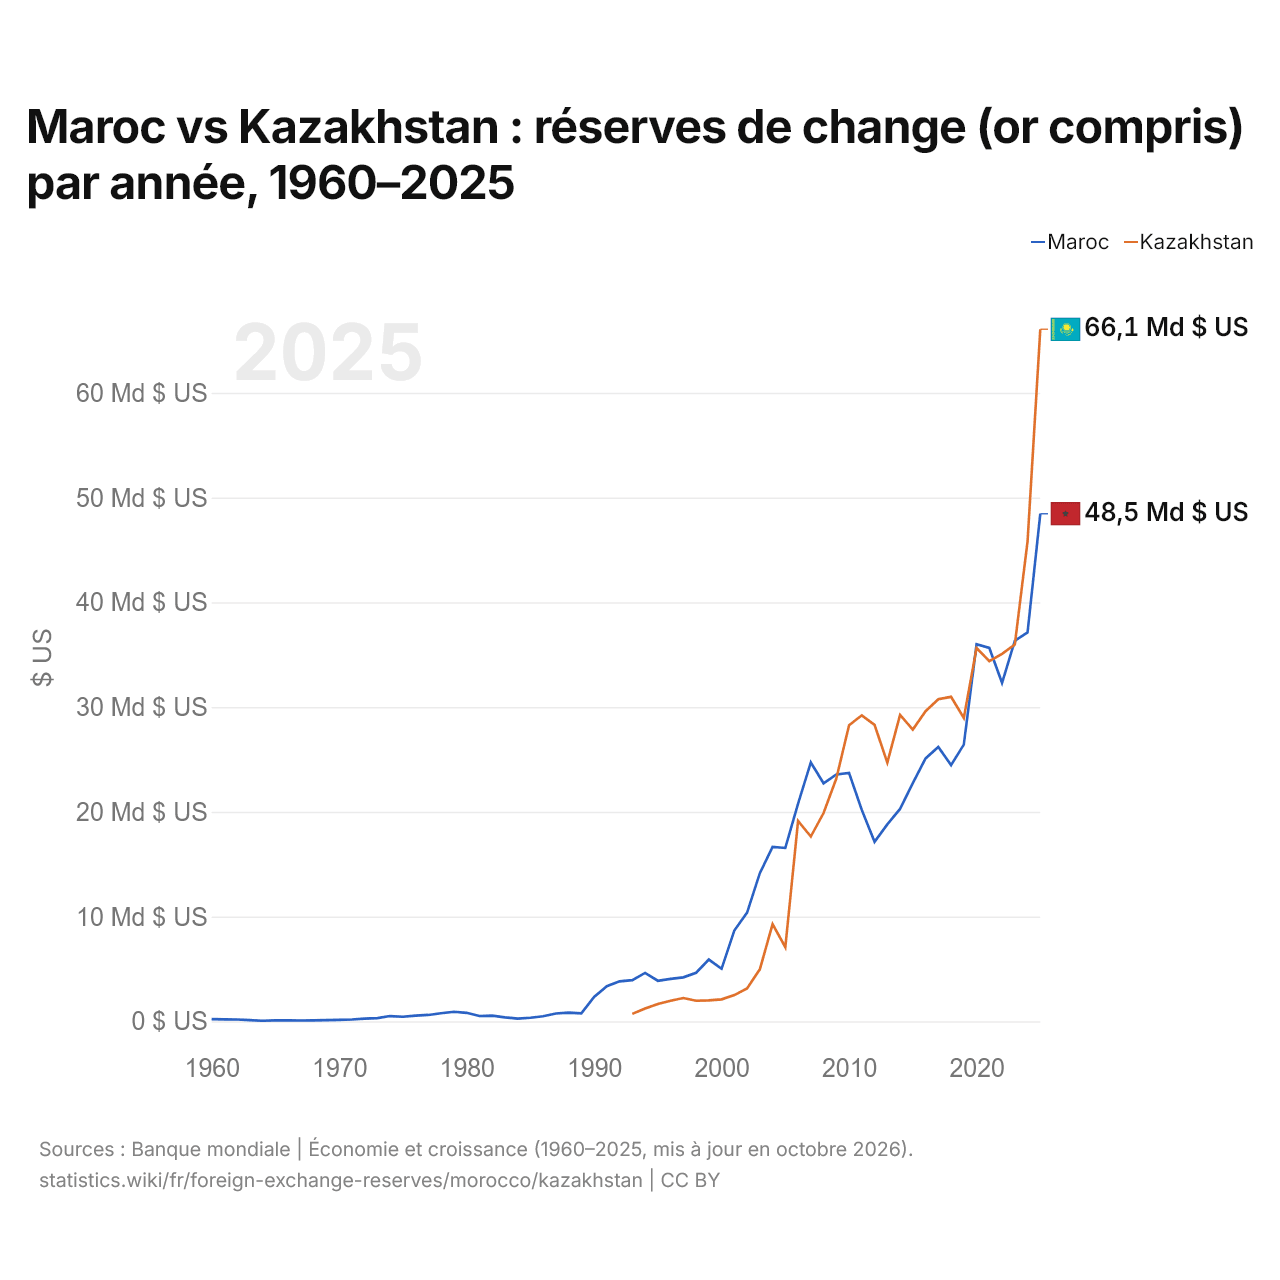
En 2025, les réserves de change du Maroc s'élevaient à 48,5 milliards de dollars et celles du Kazakhstan à 66,1 milliards de dollars : celles du Kazakhstan étaient supérieures de 36 %. En 1993, les réserves du Maroc étaient 5,5 fois plus élevées : 3,93 milliards de dollars pour le Maroc et 711 millions de dollars pour le Kazakhstan.
Maroc vs Kazakhstan : réserves, or compris, et mois d'importations couverts
|
Maroc
|
Kazakhstan
|
|
|---|---|---|
| Réserves, or compris | 48,5 Md $US | 66,1 Md $US |
| Mois d'importations | 6,2 | 9,9 |
| Rang mondial | 51/168 | 40/168 |
| Écart des réserves | 0,73× | 1,4× |
Comparer les réserves de change de 2 pays au choix
Sources :
- Banque mondiale | Économie et croissance (1960–2025, mis à jour en octobre 2026)
Creative Commons Attribution (CC BY) : vous pouvez copier, partager, adapter et réutiliser ce contenu, y compris à des fins commerciales, à condition de citer statistics.wiki et d’indiquer les modifications apportées. Les sources citées ci-dessus peuvent avoir leurs propres conditions de licence.