
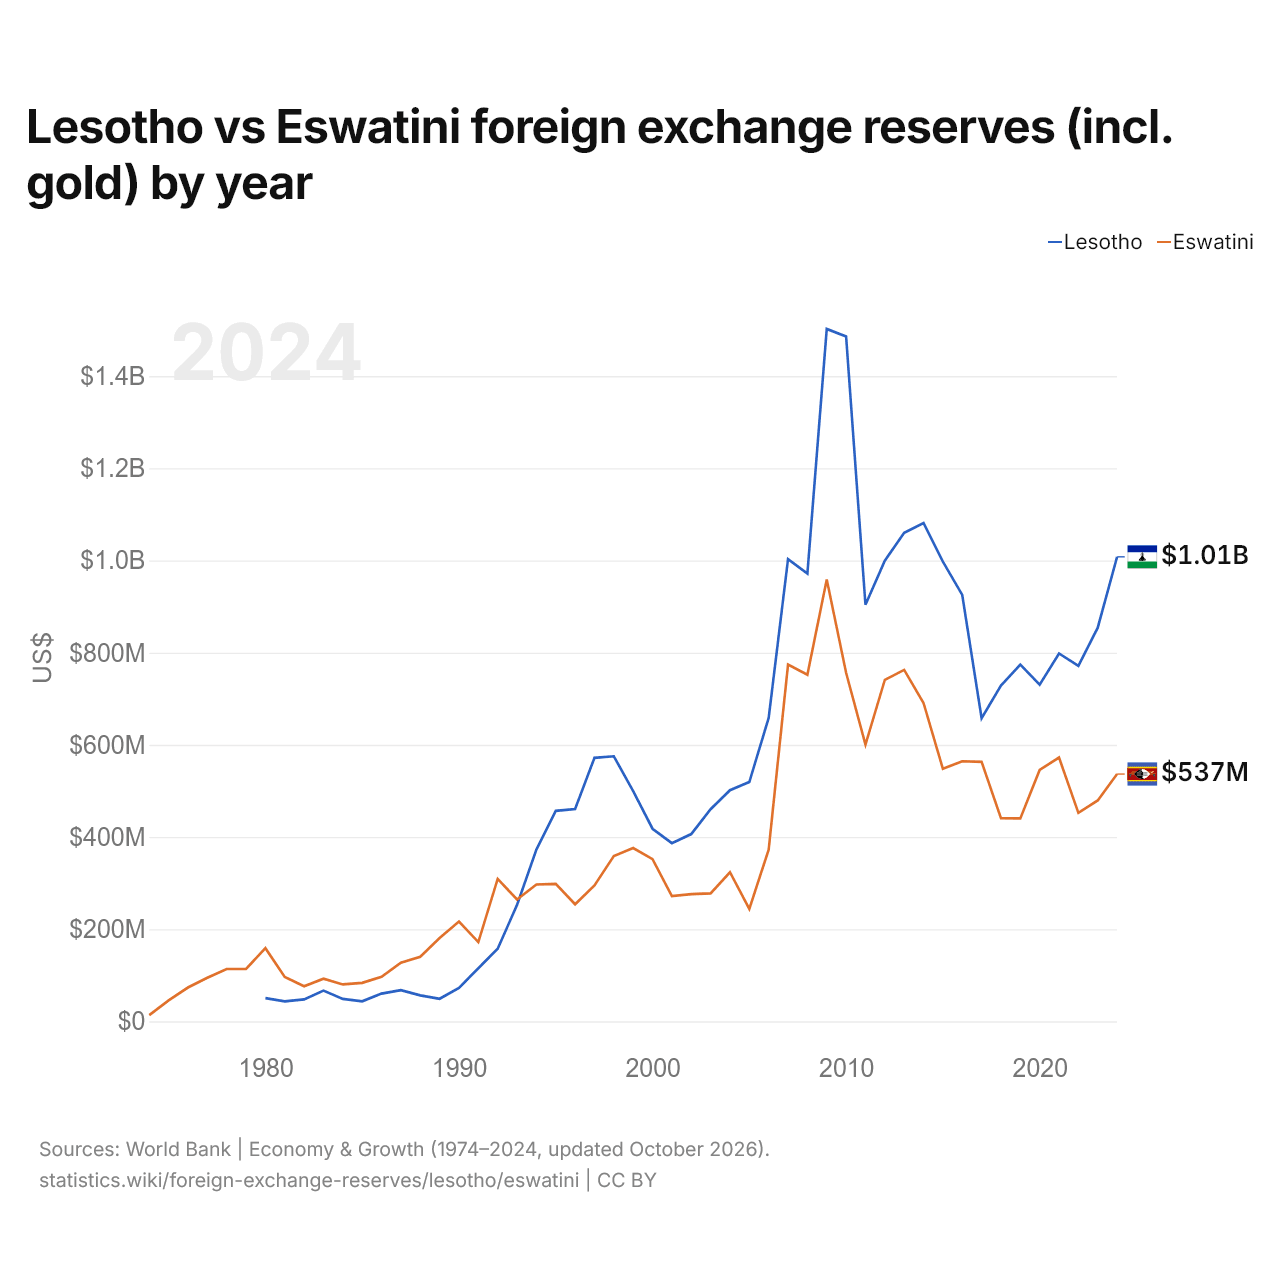
Lesotho vs Eswatini : réserves de change (or compris) par année
| Année | $ US | |
|---|---|---|
 Lesotho |
 Eswatini |
|
| 2024 | 1 007 862 057 $ US | 536 572 586 $ US |
| 2023 | 854 088 924 $ US | 479 261 051 $ US |
| 2022 | 771 278 260 $ US | 452 351 748 $ US |
| 2021 | 798 207 194 $ US | 572 281 511 $ US |
| 2020 | 730 280 379 $ US | 545 564 174 $ US |
| 2019 | 774 095 190 $ US | 440 314 153 $ US |
| 2018 | 728 527 650 $ US | 440 685 903 $ US |
| 2017 | 657 668 309 $ US | 563 119 751 $ US |
| 2016 | 925 195 319 $ US | 564 314 116 $ US |
| 2015 | 997 431 660 $ US | 547 997 264 $ US |
| 2014 | 1 081 271 062 $ US | 690 755 431 $ US |
| 2013 | 1 060 172 209 $ US | 762 540 938 $ US |
| 2012 | 999 498 708 $ US | 740 960 093 $ US |
| 2011 | 903 895 915 $ US | 600 507 429 $ US |
| 2010 | 1 485 976 653 $ US | 756 344 145 $ US |
| 2009 | 1 502 248 532 $ US | 958 869 319 $ US |
| 2008 | 971 530 252 $ US | 751 935 735 $ US |
| 2007 | 1 002 760 338 $ US | 774 192 963 $ US |
| 2006 | 658 401 555 $ US | 372 529 356 $ US |
| 2005 | 519 110 911 $ US | 243 897 157 $ US |
| 2004 | 501 504 280 $ US | 323 561 616 $ US |
| 2003 | 460 333 705 $ US | 277 512 202 $ US |
| 2002 | 406 370 215 $ US | 275 844 477 $ US |
| 2001 | 386 488 997 $ US | 271 776 570 $ US |
| 2000 | 417 891 096 $ US | 351 794 141 $ US |
| 1999 | 499 556 717 $ US | 375 930 169 $ US |
| 1998 | 575 080 928 $ US | 358 611 455 $ US |
| 1997 | 571 737 996 $ US | 294 839 207 $ US |
| 1996 | 460 505 561 $ US | 253 999 530 $ US |
| 1995 | 456 739 364 $ US | 298 195 461 $ US |
| 1994 | 372 621 135 $ US | 296 970 645 $ US |
| 1993 | 252 685 723 $ US | 264 288 573 $ US |
| 1992 | 157 486 271 $ US | 309 055 046 $ US |
| 1991 | 115 039 951 $ US | 171 931 837 $ US |
| 1990 | 72 373 877 $ US | 216 466 813 $ US |
| 1989 | 48 997 753 $ US | 180 614 473 $ US |
| 1988 | 56 281 272 $ US | 140 008 663 $ US |
| 1987 | 67 531 269 $ US | 127 160 624 $ US |
| 1986 | 60 259 785 $ US | 96 446 657 $ US |
| 1985 | 43 520 457 $ US | 83 418 805 $ US |
| 1984 | 48 576 065 $ US | 80 100 442 $ US |
| 1983 | 66 677 060 $ US | 92 498 850 $ US |
| 1982 | 47 535 431 $ US | 76 124 506 $ US |
| 1981 | 43 395 441 $ US | 96 362 337 $ US |
| 1980 | 50 268 481 $ US | 158 744 509 $ US |
| 1979 | - | 113 704 927 $ US |
| 1978 | - | 113 608 512 $ US |
| 1977 | - | 94 706 225 $ US |
| 1976 | - | 73 385 785 $ US |
| 1975 | - | 45 611 557 $ US |
| 1974 | - | 13 472 681 $ US |
Les réserves de change du Lesotho s'élèvent à 1,01 milliard de dollars (2024) et celles de l'Eswatini à 537 millions de dollars (2024) : celles du Lesotho sont 1,9 fois plus élevées. En 1980, les réserves de l'Eswatini étaient 3,2 fois plus élevées : 50,3 millions de dollars pour le Lesotho et 159 millions de dollars pour l'Eswatini.
Les réserves de change du Lesotho sont supérieures à celles de l'Eswatini chaque année depuis 1994.
Lesotho vs Eswatini : réserves, or compris, et mois d'importations couverts
|
Lesotho
|
Eswatini
|
|
|---|---|---|
| Réserves, or compris | 1,01 Md $US | 537 M $US |
| Mois d'importations | 4,9 | 2,5 |
| Rang mondial | 137/168 | 152/168 |
| Écart des réserves | 1,9× | 0,53× |
Comparer les réserves de change de 2 pays au choix
Sources :
- Banque mondiale | Économie et croissance (1974–2024, mis à jour en octobre 2026)
Creative Commons Attribution (CC BY) : vous pouvez copier, partager, adapter et réutiliser ce contenu, y compris à des fins commerciales, à condition de citer statistics.wiki et d’indiquer les modifications apportées. Les sources citées ci-dessus peuvent avoir leurs propres conditions de licence.