
Kenya vs Algérie : réserves de change (or compris) par année, 1960–2025
| Année | $ US | |
|---|---|---|
 Kenya |
 Algérie |
|
| 2025 | 12 394 288 741 $ US | 76 825 229 206 $ US |
| 2024 | 10 066 607 177 $ US | 83 007 108 429 $ US |
| 2023 | 7 341 776 190 $ US | 81 216 738 412 $ US |
| 2022 | 7 969 488 013 $ US | 71 852 290 094 $ US |
| 2021 | 9 490 896 581 $ US | 56 211 005 199 $ US |
| 2020 | 8 297 263 559 $ US | 59 434 389 110 $ US |
| 2019 | 9 115 806 005 $ US | 71 795 950 715 $ US |
| 2018 | 8 164 380 806 $ US | 87 382 910 154 $ US |
| 2017 | 7 325 420 063 $ US | 104 852 543 743 $ US |
| 2016 | 7 553 884 913 $ US | 120 788 088 861 $ US |
| 2015 | 7 514 864 907 $ US | 150 595 236 895 $ US |
| 2014 | 7 874 414 432 $ US | 186 350 590 141 $ US |
| 2013 | 6 598 881 869 $ US | 201 436 604 412 $ US |
| 2012 | 5 711 831 325 $ US | 200 586 904 241 $ US |
| 2011 | 4 265 145 710 $ US | 191 369 111 470 $ US |
| 2010 | 4 320 858 499 $ US | 170 461 132 879 $ US |
| 2009 | 3 849 500 809 $ US | 155 111 906 772 $ US |
| 2008 | 2 878 951 355 $ US | 148 098 646 077 $ US |
| 2007 | 3 355 419 016 $ US | 114 972 269 712 $ US |
| 2006 | 2 416 073 243 $ US | 81 462 730 475 $ US |
| 2005 | 1 799 087 913 $ US | 59 167 068 864 $ US |
| 2004 | 1 519 538 697 $ US | 45 691 652 467 $ US |
| 2003 | 1 482 117 159 $ US | 35 454 600 266 $ US |
| 2002 | 1 068 140 537 $ US | 25 151 012 703 $ US |
| 2001 | 1 064 987 677 $ US | 19 625 060 613 $ US |
| 2000 | 897 865 882 $ US | 13 556 106 802 $ US |
| 1999 | 791 589 618 $ US | 6 146 079 211 $ US |
| 1998 | 783 051 364 $ US | 8 452 272 525 $ US |
| 1997 | 811 092 756 $ US | 9 666 874 795 $ US |
| 1996 | 775 927 062 $ US | 6 296 459 575 $ US |
| 1995 | 384 262 966 $ US | 4 164 319 964 $ US |
| 1994 | 588 142 007 $ US | 4 813 488 033 $ US |
| 1993 | 436 745 056 $ US | 3 655 668 338 $ US |
| 1992 | 79 549 253 $ US | 3 317 517 177 $ US |
| 1991 | 145 138 376 $ US | 3 459 969 141 $ US |
| 1990 | 236 115 155 $ US | 2 703 474 408 $ US |
| 1989 | 316 624 629 $ US | 3 085 702 760 $ US |
| 1988 | 296 453 946 $ US | 3 190 542 199 $ US |
| 1987 | 294 401 563 $ US | 4 343 099 115 $ US |
| 1986 | 444 494 690 $ US | 3 842 516 472 $ US |
| 1985 | 416 724 735 $ US | 4 644 533 024 $ US |
| 1984 | 414 388 462 $ US | 3 185 336 009 $ US |
| 1983 | 406 428 159 $ US | 4 010 232 279 $ US |
| 1982 | 248 102 847 $ US | 4 972 783 276 $ US |
| 1981 | 262 828 031 $ US | 5 914 588 650 $ US |
| 1980 | 538 712 189 $ US | 7 063 796 833 $ US |
| 1979 | 668 545 449 $ US | 5 517 255 565 $ US |
| 1978 | 368 830 302 $ US | 3 229 638 828 $ US |
| 1977 | 525 784 883 $ US | 2 590 691 196 $ US |
| 1976 | 275 522 172 $ US | 2 502 228 025 $ US |
| 1975 | 173 405 884 $ US | 1 895 709 477 $ US |
| 1974 | 193 282 886 $ US | 2 474 721 194 $ US |
| 1973 | 233 045 795 $ US | 1 526 311 529 $ US |
| 1972 | 201 994 376 $ US | 640 169 274 $ US |
| 1971 | 170 946 360 $ US | 537 318 204 $ US |
| 1970 | 219 830 000 $ US | 352 276 530 $ US |
| 1969 | 169 660 000 $ US | 410 627 600 $ US |
| 1968 | 100 050 000 $ US | 532 109 700 $ US |
| 1967 | 75 830 000 $ US | 442 988 000 $ US |
| 1966 | 52 400 000 $ US | 273 085 970 $ US |
| 1965 | 19 950 000 $ US | 184 224 560 $ US |
| 1964 | - | 194 924 560 $ US |
| 1963 | - | 237 218 040 $ US |
| 1962 | - | 185 716 410 $ US |
| 1961 | - | 311 729 450 $ US |
| 1960 | - | 265 802 800 $ US |
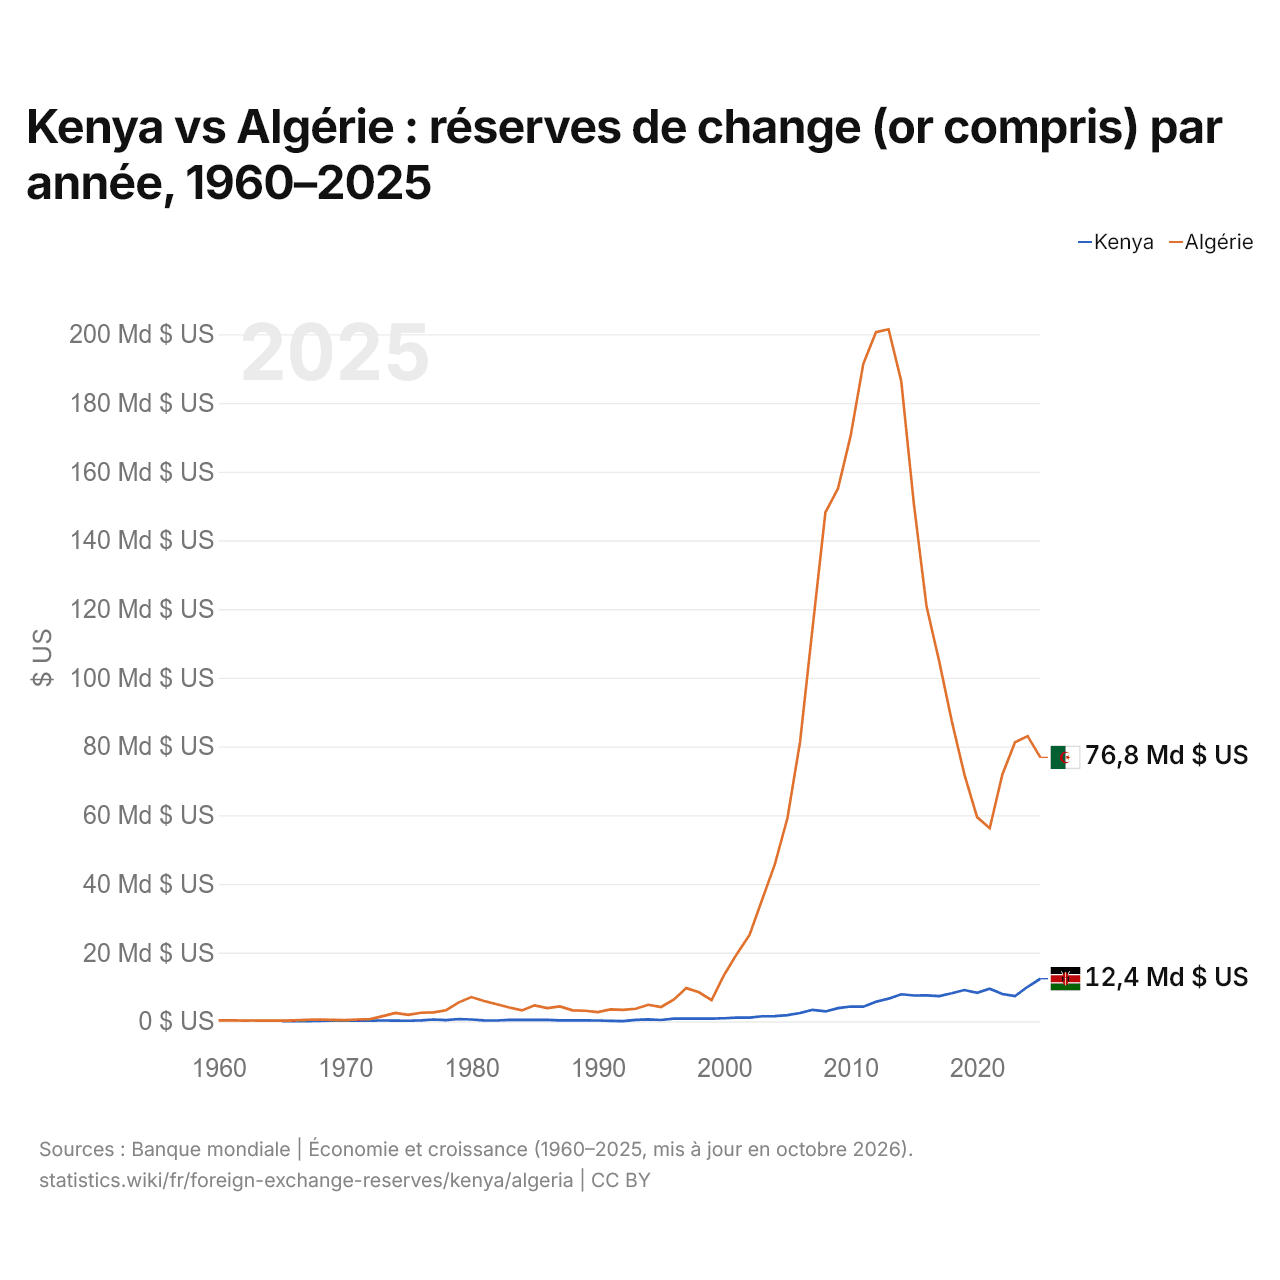
En 2025, les réserves de change du Kenya s'élevaient à 12,4 milliards de dollars et celles de l'Algérie à 76,8 milliards de dollars : celles de l'Algérie étaient 6,2 fois plus élevées. En 1965, les réserves de l'Algérie étaient 9,2 fois plus élevées : 20 millions de dollars pour le Kenya et 184 millions de dollars pour l'Algérie.
Les réserves de change de l'Algérie sont supérieures à celles du Kenya chaque année depuis 1965.
Kenya vs Algérie : réserves, or compris, et mois d'importations couverts
|
Kenya
|
Algérie
|
|
|---|---|---|
| Réserves, or compris | 12,4 Md $US | 76,8 Md $US |
| Mois d'importations | 5,0 | 14,5 |
| Rang mondial | 75/168 | 35/168 |
| Écart des réserves | 0,16× | 6,2× |
Comparer les réserves de change de 2 pays au choix
Sources :
- Banque mondiale | Économie et croissance (1960–2025, mis à jour en octobre 2026)
Creative Commons Attribution (CC BY) : vous pouvez copier, partager, adapter et réutiliser ce contenu, y compris à des fins commerciales, à condition de citer statistics.wiki et d’indiquer les modifications apportées. Les sources citées ci-dessus peuvent avoir leurs propres conditions de licence.