
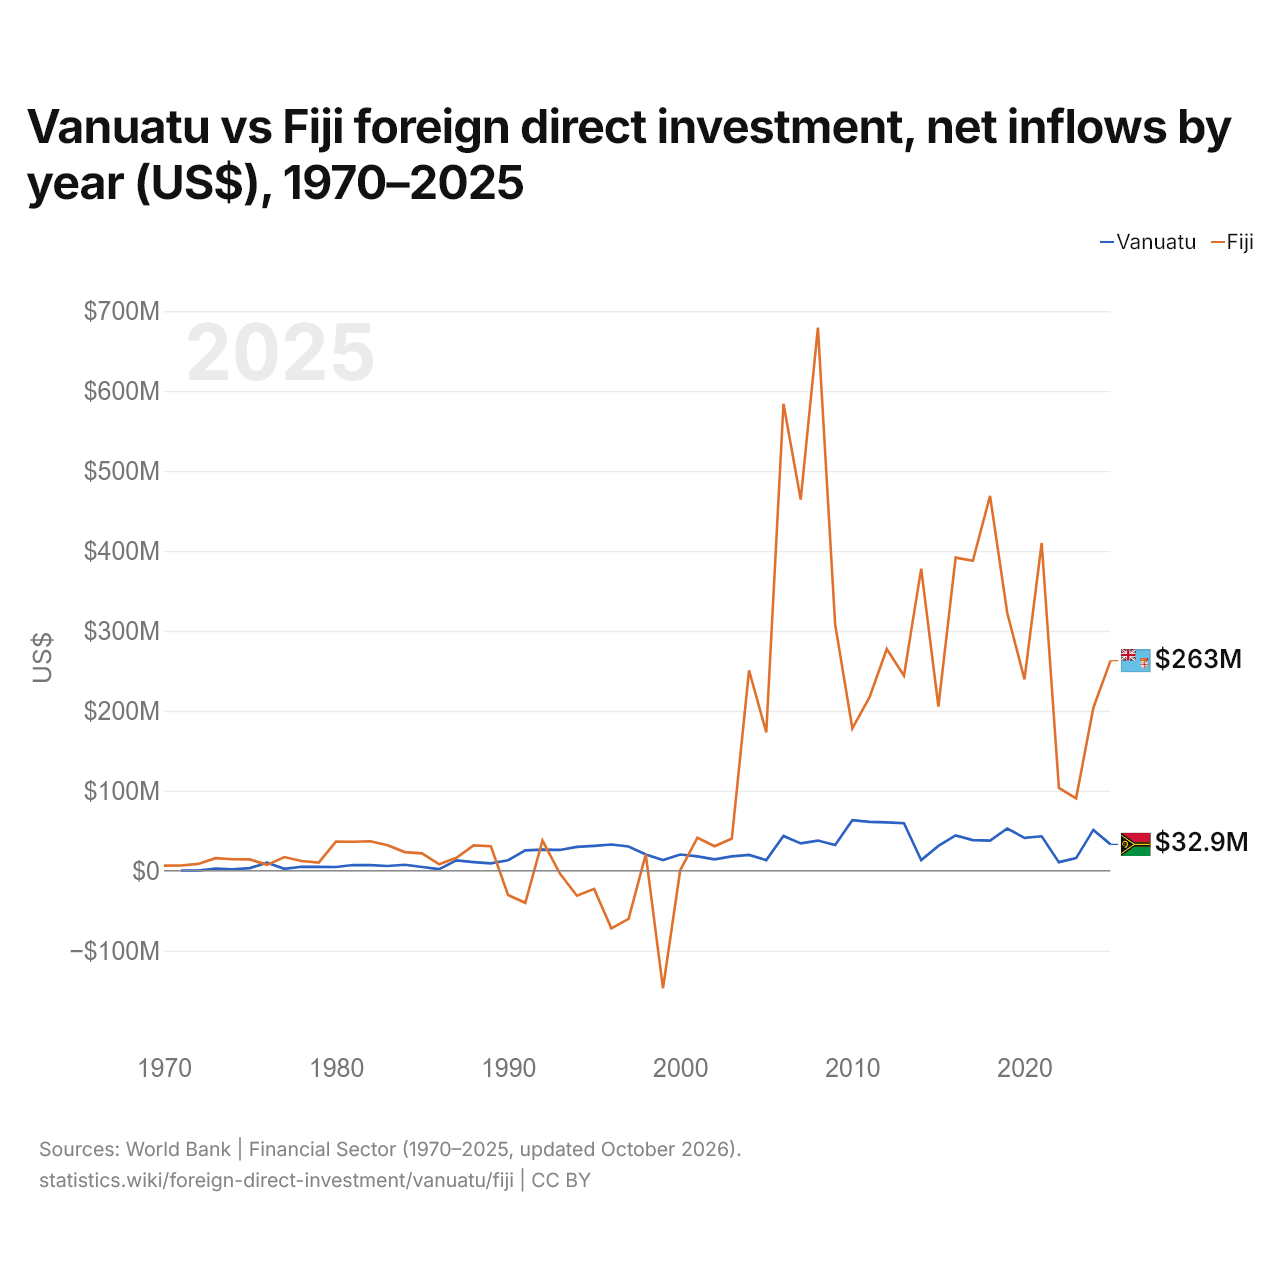
Vanuatu vs Fidji : investissements directs étrangers, entrées nettes par année ($ US), 1970–2025
| Année | $ US | |
|---|---|---|
 Vanuatu |
 Fidji |
|
| 2025 | 32 918 506 $ US | 262 762 648 $ US |
| 2024 | 51 072 043 $ US | 203 609 191 $ US |
| 2023 | 15 724 630 $ US | 90 569 883 $ US |
| 2022 | 10 694 983 $ US | 103 581 592 $ US |
| 2021 | 43 055 519 $ US | 409 894 560 $ US |
| 2020 | 41 158 956 $ US | 239 380 738 $ US |
| 2019 | 52 849 932 $ US | 322 282 826 $ US |
| 2018 | 37 583 468 $ US | 468 861 003 $ US |
| 2017 | 38 222 690 $ US | 387 602 565 $ US |
| 2016 | 44 178 569 $ US | 391 619 655 $ US |
| 2015 | 31 021 246 $ US | 205 373 209 $ US |
| 2014 | 13 266 164 $ US | 377 869 372 $ US |
| 2013 | 59 379 213 $ US | 243 782 754 $ US |
| 2012 | 60 388 540 $ US | 277 313 672 $ US |
| 2011 | 61 117 731 $ US | 217 158 526 $ US |
| 2010 | 63 109 399 $ US | 178 091 736 $ US |
| 2009 | 32 140 846 $ US | 308 373 711 $ US |
| 2008 | 37 694 497 $ US | 679 220 489 $ US |
| 2007 | 34 155 235 $ US | 464 230 334 $ US |
| 2006 | 43 447 012 $ US | 583 975 309 $ US |
| 2005 | 13 251 642 $ US | 172 951 929 $ US |
| 2004 | 19 840 844 $ US | 250 597 673 $ US |
| 2003 | 18 010 732 $ US | 40 310 495 $ US |
| 2002 | 14 162 545 $ US | 30 672 578 $ US |
| 2001 | 18 004 322 $ US | 41 301 896 $ US |
| 2000 | 20 256 090 $ US | 591 375 $ US |
| 1999 | 13 403 367 $ US | −147 083 836 $ US |
| 1998 | 20 383 379 $ US | 20 334 035 $ US |
| 1997 | 30 233 300 $ US | −60 193 603 $ US |
| 1996 | 32 732 116 $ US | −72 186 988 $ US |
| 1995 | 31 044 915 $ US | −22 683 100 $ US |
| 1994 | 29 786 176 $ US | −31 281 482 $ US |
| 1993 | 25 967 921 $ US | −3 243 015 $ US |
| 1992 | 26 452 894 $ US | 37 791 315 $ US |
| 1991 | 25 474 518 $ US | −40 188 200 $ US |
| 1990 | 13 111 197 $ US | −30 386 756 $ US |
| 1989 | 9 168 584 $ US | 30 606 742 $ US |
| 1988 | 10 813 577 $ US | 31 602 682 $ US |
| 1987 | 12 893 062 $ US | 16 159 397 $ US |
| 1986 | 2 017 425 $ US | 8 032 725 $ US |
| 1985 | 4 625 776 $ US | 21 672 151 $ US |
| 1984 | 7 437 906 $ US | 23 314 315 $ US |
| 1983 | 5 867 100 $ US | 31 946 264 $ US |
| 1982 | 6 932 931 $ US | 36 827 765 $ US |
| 1981 | 7 121 000 $ US | 36 249 750 $ US |
| 1980 | 4 635 500 $ US | 36 334 088 $ US |
| 1979 | 4 890 000 $ US | 10 170 588 $ US |
| 1978 | 4 920 000 $ US | 12 190 000 $ US |
| 1977 | 2 350 000 $ US | 17 100 000 $ US |
| 1976 | 10 100 000 $ US | 7 330 000 $ US |
| 1975 | 3 250 000 $ US | 14 100 000 $ US |
| 1974 | 1 790 000 $ US | 14 300 000 $ US |
| 1973 | 2 800 000 $ US | 15 700 000 $ US |
| 1972 | 40 000 $ US | 8 500 000 $ US |
| 1971 | 10 000 $ US | 6 500 000 $ US |
| 1970 | - | 6 400 000 $ US |
En 2025, les entrées nettes d'investissements directs étrangers étaient de 32,9 millions de dollars au Vanuatu et de 263 millions de dollars aux Fidji : 8,0 fois plus aux Fidji. En 1971, elles étaient de 10 000 dollars au Vanuatu et de 6,5 millions de dollars aux Fidji.
Les entrées nettes d'investissements directs étrangers au Vanuatu ont été supérieures à celles des Fidji pendant 11 des 55 années de 1971 à 2025, et inférieures pendant 44.
Vanuatu vs Fidji : dernières entrées et sorties d'investissements étrangers
|
Vanuatu
|
Fidji
|
|
|---|---|---|
| Entrées nettes | +32,9 M $US | +263 M $US |
| Entrées nettes, % du PIB | +2,4 % | +4,2 % |
| Sorties nettes | +2,75 M $US | +43,1 M $US |
| Entrées nettes, total 2016–2025 | +367 M $US | +2,88 Md $US |
| Rang mondial | 161/192 | 132/192 |
Comparer les investissements directs étrangers de 2 pays au choix
Sources :
- Banque mondiale | Secteur financier (1970–2025, mis à jour en octobre 2026)
Creative Commons Attribution (CC BY) : vous pouvez copier, partager, adapter et réutiliser ce contenu, y compris à des fins commerciales, à condition de citer statistics.wiki et d’indiquer les modifications apportées. Les sources citées ci-dessus peuvent avoir leurs propres conditions de licence.