
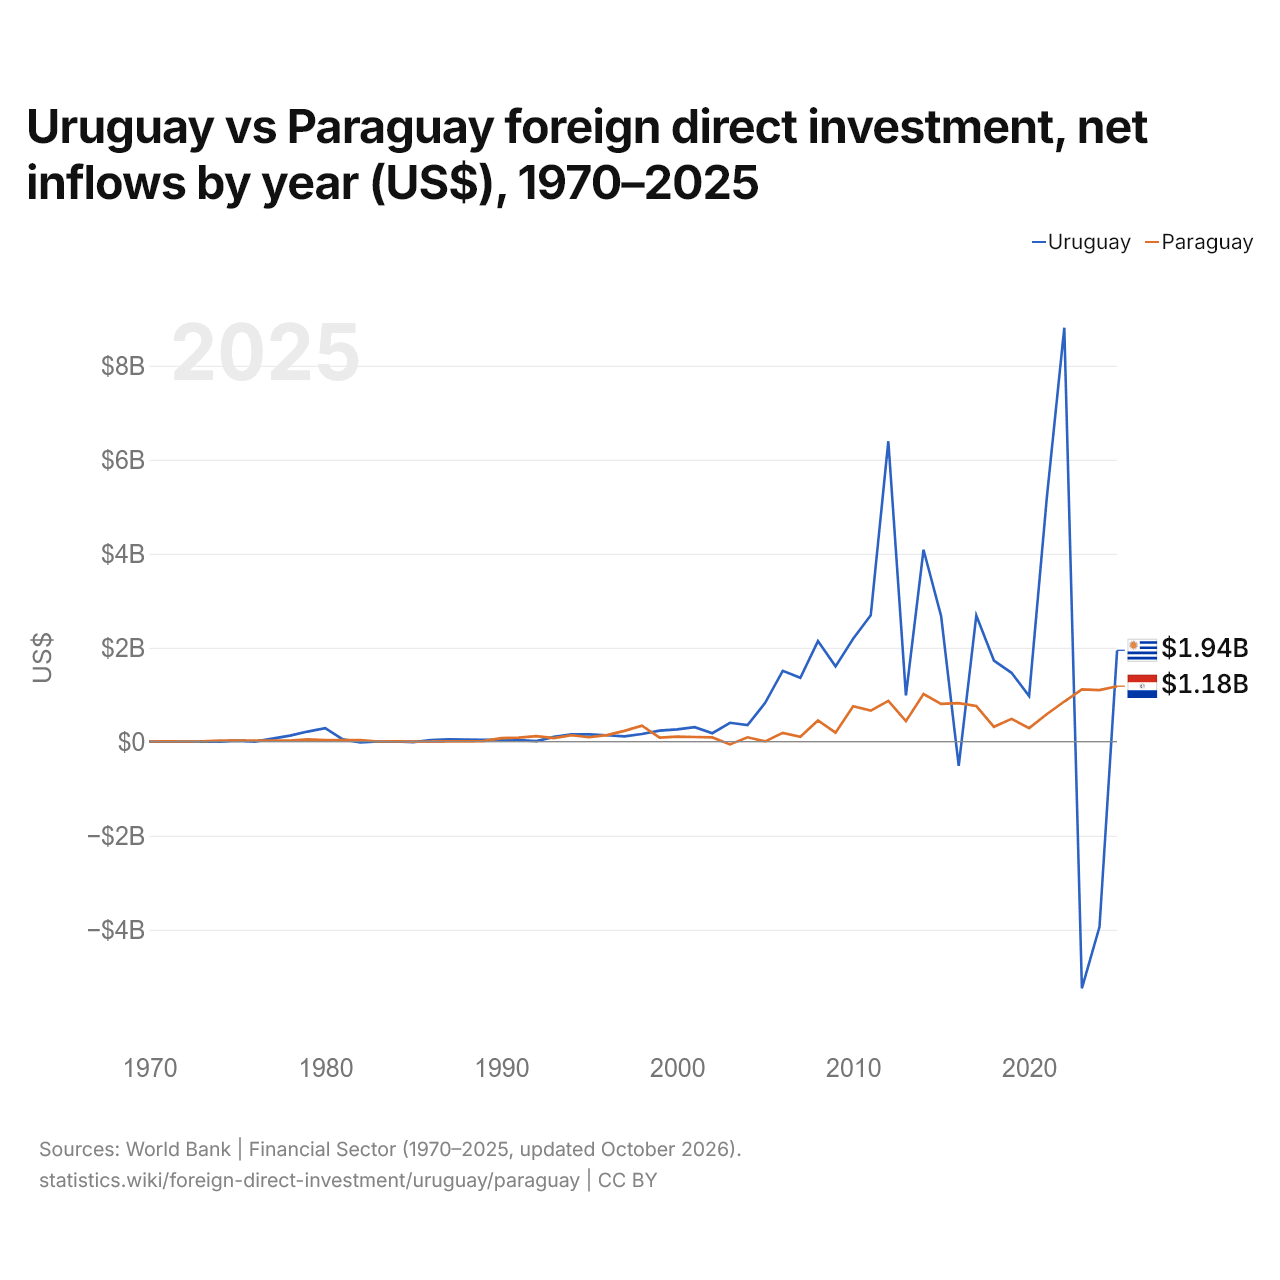
Uruguay vs Paraguay : investissements directs étrangers, entrées nettes par année ($ US), 1970–2025
| Année | $ US | |
|---|---|---|
 Uruguay |
 Paraguay |
|
| 2025 | 1 944 976 916 $ US | 1 180 338 809 $ US |
| 2024 | −3 940 437 636 $ US | 1 097 421 001 $ US |
| 2023 | −5 248 090 937 $ US | 1 111 730 624 $ US |
| 2022 | 8 810 431 895 $ US | 855 187 936 $ US |
| 2021 | 5 165 277 108 $ US | 584 062 882 $ US |
| 2020 | 973 445 344 $ US | 289 383 010 $ US |
| 2019 | 1 466 600 722 $ US | 485 530 746 $ US |
| 2018 | 1 726 550 037 $ US | 316 757 299 $ US |
| 2017 | 2 686 509 353 $ US | 759 201 270 $ US |
| 2016 | −515 650 078 $ US | 819 354 146 $ US |
| 2015 | 2 673 041 339 $ US | 805 164 472 $ US |
| 2014 | 4 085 227 627 $ US | 1 014 914 413 $ US |
| 2013 | 986 930 051 $ US | 435 973 725 $ US |
| 2012 | 6 394 069 822 $ US | 868 971 987 $ US |
| 2011 | 2 690 094 197 $ US | 661 201 188 $ US |
| 2010 | 2 191 067 967 $ US | 752 873 110 $ US |
| 2009 | 1 602 591 813 $ US | 192 405 075 $ US |
| 2008 | 2 141 969 341 $ US | 451 699 194 $ US |
| 2007 | 1 358 736 506 $ US | 105 000 000 $ US |
| 2006 | 1 508 350 269 $ US | 187 800 000 $ US |
| 2005 | 826 626 704 $ US | 7 300 000 $ US |
| 2004 | 352 712 784 $ US | 93 979 000 $ US |
| 2003 | 402 717 369 $ US | −57 700 000 $ US |
| 2002 | 179 852 188 $ US | 90 400 000 $ US |
| 2001 | 310 402 928 $ US | 99 200 000 $ US |
| 2000 | 262 825 000 $ US | 107 800 000 $ US |
| 1999 | 235 300 000 $ US | 87 200 000 $ US |
| 1998 | 164 100 000 $ US | 340 600 000 $ US |
| 1997 | 113 200 000 $ US | 230 900 000 $ US |
| 1996 | 136 800 000 $ US | 139 800 000 $ US |
| 1995 | 156 600 000 $ US | 94 500 000 $ US |
| 1994 | 154 500 000 $ US | 137 100 000 $ US |
| 1993 | 101 500 000 $ US | 75 000 000 $ US |
| 1992 | 11 300 000 $ US | 117 500 000 $ US |
| 1991 | 32 340 000 $ US | 86 100 000 $ US |
| 1990 | 41 540 000 $ US | 76 900 000 $ US |
| 1989 | 37 700 000 $ US | 12 800 000 $ US |
| 1988 | 46 800 000 $ US | 8 400 000 $ US |
| 1987 | 50 100 000 $ US | 5 300 000 $ US |
| 1986 | 37 000 000 $ US | 600 000 $ US |
| 1985 | −7 900 000 $ US | 700 000 $ US |
| 1984 | 3 400 000 $ US | 5 200 000 $ US |
| 1983 | 5 600 000 $ US | 4 900 000 $ US |
| 1982 | −13 700 000 $ US | 36 600 000 $ US |
| 1981 | 48 600 000 $ US | 31 900 000 $ US |
| 1980 | 289 500 000 $ US | 31 700 000 $ US |
| 1979 | 215 500 000 $ US | 50 200 000 $ US |
| 1978 | 128 800 000 $ US | 24 600 000 $ US |
| 1977 | 66 000 000 $ US | 21 700 000 $ US |
| 1976 | 3 150 000 $ US | 22 000 000 $ US |
| 1975 | 22 640 000 $ US | 24 400 000 $ US |
| 1974 | −80 000 $ US | 23 656 000 $ US |
| 1973 | 1 390 000 $ US | 9 200 000 $ US |
| 1972 | −1 140 000 $ US | 3 481 000 $ US |
| 1971 | −830 000 $ US | 7 100 000 $ US |
| 1970 | 2 130 000 $ US | 4 752 000 $ US |
En 2025, les entrées nettes d'investissements directs étrangers étaient de 1,94 milliard de dollars en Uruguay et de 1,18 milliard de dollars au Paraguay : 1,6 fois plus en Uruguay. En 1970, elles étaient de 2,13 millions de dollars en Uruguay et de 4,75 millions de dollars au Paraguay.
Les entrées nettes d'investissements directs étrangers en Uruguay ont été supérieures à celles du Paraguay pendant 37 des 56 années de 1970 à 2025, et inférieures pendant 19.
Uruguay vs Paraguay : dernières entrées et sorties d'investissements étrangers
|
Uruguay
|
Paraguay
|
|
|---|---|---|
| Entrées nettes | +1,94 Md $US | +1,18 Md $US |
| Entrées nettes, % du PIB | +2,3 % | +2,4 % |
| Sorties nettes | +1,41 Md $US | +236 M $US |
| Entrées nettes, total 2016–2025 | +13,1 Md $US | +7,50 Md $US |
| Rang mondial | 67/192 | 87/192 |
Comparer les investissements directs étrangers de 2 pays au choix
Sources :
- Banque mondiale | Secteur financier (1970–2025, mis à jour en octobre 2026)
Creative Commons Attribution (CC BY) : vous pouvez copier, partager, adapter et réutiliser ce contenu, y compris à des fins commerciales, à condition de citer statistics.wiki et d’indiquer les modifications apportées. Les sources citées ci-dessus peuvent avoir leurs propres conditions de licence.