
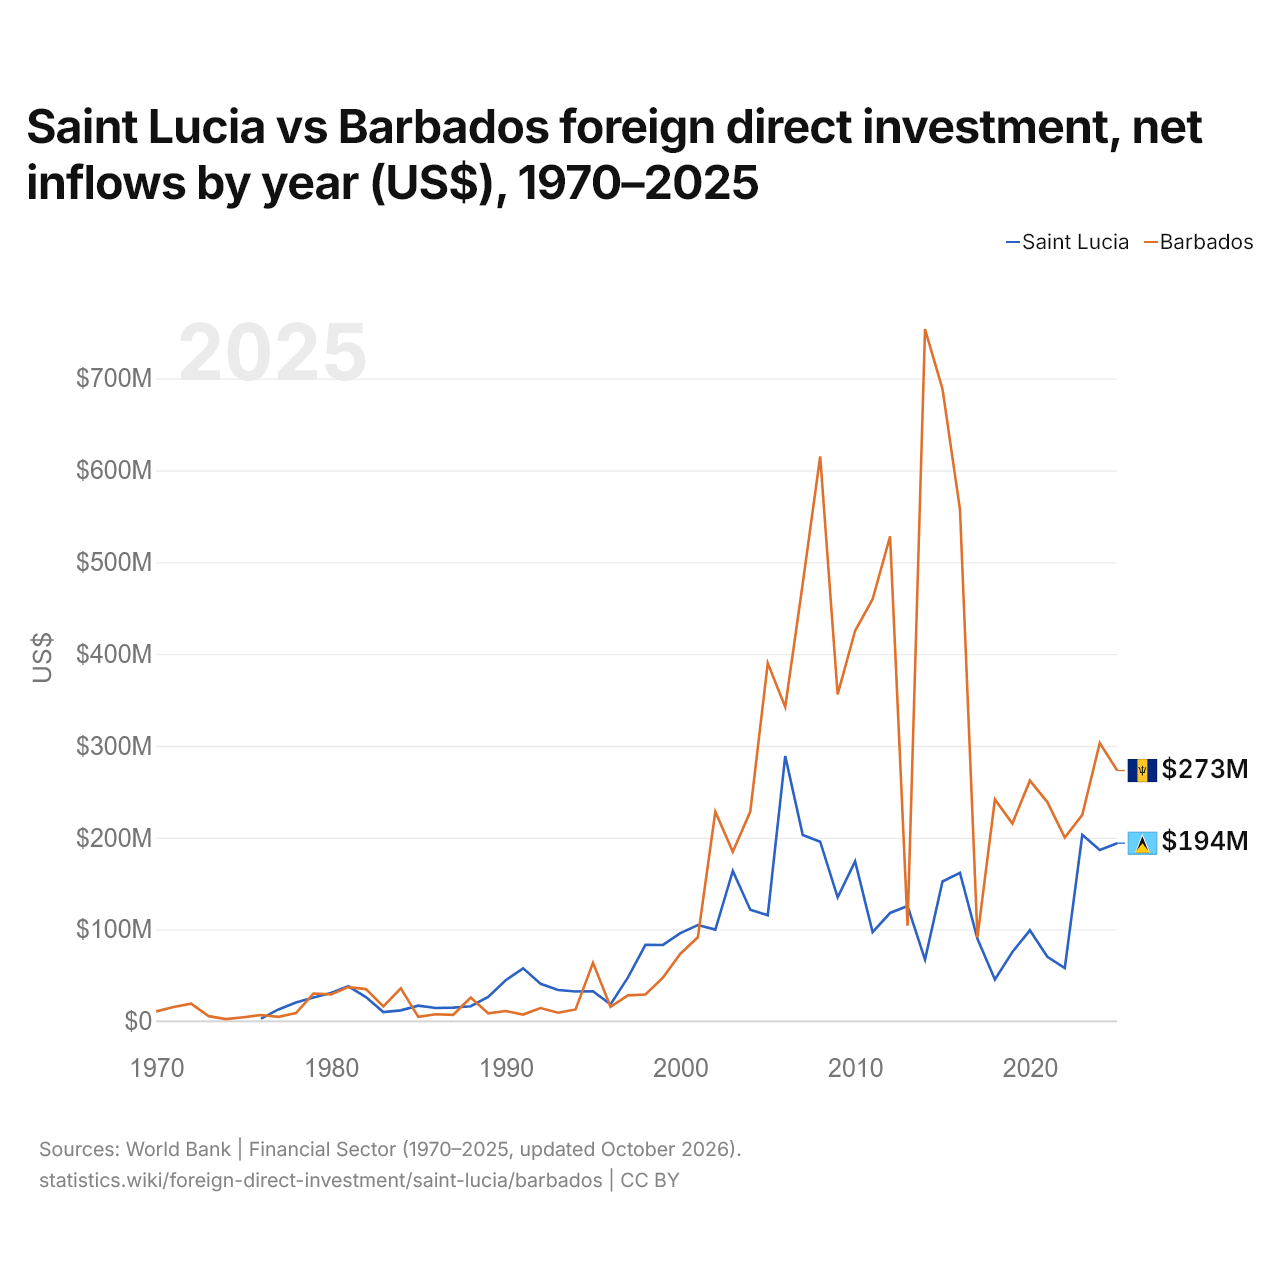
Sainte-Lucie vs Barbade : investissements directs étrangers, entrées nettes par année ($ US), 1970–2025
| Année | $ US | |
|---|---|---|
 Sainte-Lucie |
 Barbade |
|
| 2025 | 193 977 027 $ US | 273 091 359 $ US |
| 2024 | 186 610 181 $ US | 303 060 013 $ US |
| 2023 | 203 075 681 $ US | 224 900 000 $ US |
| 2022 | 58 043 441 $ US | 200 000 000 $ US |
| 2021 | 70 224 234 $ US | 238 735 064 $ US |
| 2020 | 99 135 485 $ US | 262 100 000 $ US |
| 2019 | 75 509 998 $ US | 215 370 129 $ US |
| 2018 | 45 522 201 $ US | 241 596 500 $ US |
| 2017 | 89 941 452 $ US | 91 481 933 $ US |
| 2016 | 161 613 066 $ US | 557 500 316 $ US |
| 2015 | 152 240 176 $ US | 688 525 943 $ US |
| 2014 | 67 259 296 $ US | 753 687 476 $ US |
| 2013 | 125 625 100 $ US | 104 089 451 $ US |
| 2012 | 117 962 499 $ US | 528 045 665 $ US |
| 2011 | 97 165 775 $ US | 459 552 936 $ US |
| 2010 | 174 224 983 $ US | 425 337 313 $ US |
| 2009 | 134 978 251 $ US | 356 008 255 $ US |
| 2008 | 195 623 251 $ US | 615 122 885 $ US |
| 2007 | 202 997 586 $ US | 476 404 577 $ US |
| 2006 | 288 917 009 $ US | 342 267 498 $ US |
| 2005 | 115 484 418 $ US | 390 061 396 $ US |
| 2004 | 121 554 429 $ US | 228 334 500 $ US |
| 2003 | 163 844 777 $ US | 184 701 289 $ US |
| 2002 | 99 909 211 $ US | 228 343 254 $ US |
| 2001 | 104 822 051 $ US | 91 504 911 $ US |
| 2000 | 96 087 234 $ US | 73 696 944 $ US |
| 1999 | 83 151 852 $ US | 47 539 505 $ US |
| 1998 | 83 396 296 $ US | 29 160 482 $ US |
| 1997 | 47 825 926 $ US | 28 203 499 $ US |
| 1996 | 18 414 815 $ US | 15 836 484 $ US |
| 1995 | 32 751 852 $ US | 63 803 750 $ US |
| 1994 | 32 522 222 $ US | 12 950 000 $ US |
| 1993 | 34 162 963 $ US | 9 402 114 $ US |
| 1992 | 40 940 741 $ US | 14 450 000 $ US |
| 1991 | 57 744 444 $ US | 7 424 921 $ US |
| 1990 | 44 785 185 $ US | 11 213 283 $ US |
| 1989 | 26 629 630 $ US | 8 682 964 $ US |
| 1988 | 16 444 444 $ US | 25 979 409 $ US |
| 1987 | 15 000 000 $ US | 7 100 000 $ US |
| 1986 | 14 518 519 $ US | 7 750 000 $ US |
| 1985 | 17 000 000 $ US | 4 850 000 $ US |
| 1984 | 12 000 000 $ US | 36 000 000 $ US |
| 1983 | 10 000 000 $ US | 16 150 000 $ US |
| 1982 | 26 500 000 $ US | 35 150 000 $ US |
| 1981 | 38 200 000 $ US | 37 300 000 $ US |
| 1980 | 30 900 000 $ US | 29 300 000 $ US |
| 1979 | 26 000 000 $ US | 30 305 500 $ US |
| 1978 | 20 600 000 $ US | 8 987 000 $ US |
| 1977 | 13 000 000 $ US | 4 914 000 $ US |
| 1976 | 2 998 465 $ US | 6 897 500 $ US |
| 1975 | - | 4 489 152 $ US |
| 1974 | - | 2 397 685 $ US |
| 1973 | - | 5 630 300 $ US |
| 1972 | - | 19 139 837 $ US |
| 1971 | - | 15 656 172 $ US |
| 1970 | - | 10 868 500 $ US |
En 2025, les entrées nettes d'investissements directs étrangers étaient de 194 millions de dollars à Sainte-Lucie et de 273 millions de dollars à la Barbade : 41 % de plus à la Barbade. En 1976, elles étaient de 3 millions de dollars à Sainte-Lucie et de 6,9 millions de dollars à la Barbade.
Les entrées nettes d'investissements directs étrangers à Sainte-Lucie ont été supérieures à celles de la Barbade pendant 20 des 50 années de 1976 à 2025, et inférieures pendant 30.
Sainte-Lucie vs Barbade : dernières entrées et sorties d'investissements étrangers
|
Sainte-Lucie
|
Barbade
|
|
|---|---|---|
| Entrées nettes | +194 M $US | +273 M $US |
| Entrées nettes, % du PIB | +7,3 % | +3,4 % |
| Sorties nettes | +18,7 M $US | +16,7 M $US |
| Entrées nettes, total 2016–2025 | +1,18 Md $US | +2,61 Md $US |
| Rang mondial | 137/192 | 130/192 |
Comparer les investissements directs étrangers de 2 pays au choix
Sources :
- Banque mondiale | Secteur financier (1970–2025, mis à jour en octobre 2026)
Creative Commons Attribution (CC BY) : vous pouvez copier, partager, adapter et réutiliser ce contenu, y compris à des fins commerciales, à condition de citer statistics.wiki et d’indiquer les modifications apportées. Les sources citées ci-dessus peuvent avoir leurs propres conditions de licence.