
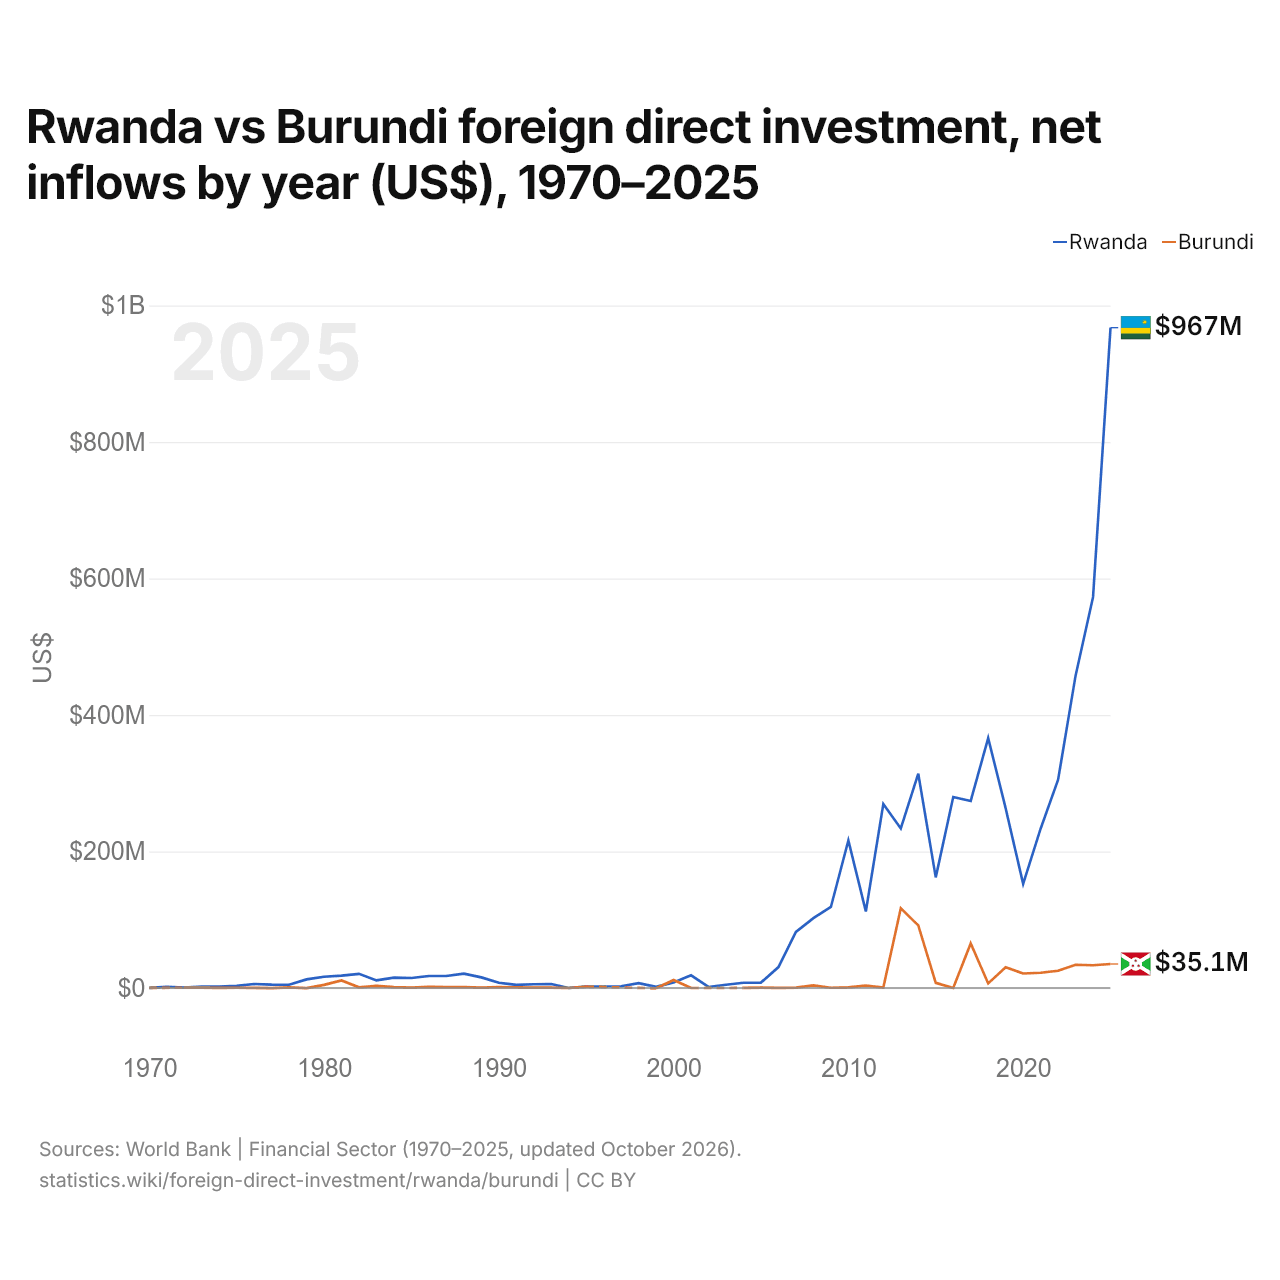
Rwanda vs Burundi : investissements directs étrangers, entrées nettes par année ($ US), 1970–2025
| Année | $ US | |
|---|---|---|
 Rwanda |
 Burundi |
|
| 2025 | 967 463 915 $ US | 35 116 090 $ US |
| 2024 | 572 929 300 $ US | 33 322 928 $ US |
| 2023 | 457 644 003 $ US | 33 999 318 $ US |
| 2022 | 305 101 863 $ US | 25 249 489 $ US |
| 2021 | 233 384 939 $ US | 22 351 623 $ US |
| 2020 | 152 614 121 $ US | 21 196 555 $ US |
| 2019 | 263 172 335 $ US | 30 280 866 $ US |
| 2018 | 366 192 316 $ US | 6 663 762 $ US |
| 2017 | 274 025 991 $ US | 65 319 815 $ US |
| 2016 | 279 747 328 $ US | 55 104 $ US |
| 2015 | 162 083 821 $ US | 7 439 565 $ US |
| 2014 | 313 997 163 $ US | 91 720 479 $ US |
| 2013 | 233 763 794 $ US | 116 727 137 $ US |
| 2012 | 269 615 550 $ US | 604 920 $ US |
| 2011 | 112 127 536 $ US | 3 354 999 $ US |
| 2010 | 216 192 557 $ US | 780 582 $ US |
| 2009 | 118 670 000 $ US | 348 405 $ US |
| 2008 | 102 290 000 $ US | 3 833 208 $ US |
| 2007 | 82 283 166 $ US | 500 245 $ US |
| 2006 | 30 643 966 $ US | 31 594 $ US |
| 2005 | 7 960 000 $ US | 584 702 $ US |
| 2004 | 7 700 000 $ US | 44 691 $ US |
| 2003 | 4 700 000 $ US | - |
| 2002 | 1 500 000 $ US | - |
| 2001 | 18 500 000 $ US | −11 441 $ US |
| 2000 | 8 100 000 $ US | 11 683 246 $ US |
| 1999 | 1 740 000 $ US | −475 191 $ US |
| 1998 | 7 100 000 $ US | - |
| 1997 | 2 590 000 $ US | - |
| 1996 | 2 220 000 $ US | - |
| 1995 | 2 000 000 $ US | 1 981 922 $ US |
| 1994 | 1 000 $ US | 3 958 $ US |
| 1993 | 5 840 000 $ US | 473 680 $ US |
| 1992 | 5 500 000 $ US | 600 088 $ US |
| 1991 | 4 580 000 $ US | 892 500 $ US |
| 1990 | 7 660 000 $ US | 1 255 435 $ US |
| 1989 | 15 540 000 $ US | 567 227 $ US |
| 1988 | 21 050 000 $ US | 1 196 624 $ US |
| 1987 | 17 550 000 $ US | 1 367 714 $ US |
| 1986 | 17 580 000 $ US | 1 524 029 $ US |
| 1985 | 14 620 000 $ US | 538 567 $ US |
| 1984 | 15 070 000 $ US | 1 190 000 $ US |
| 1983 | 11 120 000 $ US | 3 040 000 $ US |
| 1982 | 20 700 000 $ US | 900 000 $ US |
| 1981 | 18 030 000 $ US | 11 080 000 $ US |
| 1980 | 16 420 000 $ US | 4 600 000 $ US |
| 1979 | 12 570 000 $ US | −300 000 $ US |
| 1978 | 4 690 000 $ US | 890 000 $ US |
| 1977 | 4 950 000 $ US | −250 000 $ US |
| 1976 | 5 860 000 $ US | 80 000 $ US |
| 1975 | 3 000 000 $ US | 320 000 $ US |
| 1974 | 2 200 000 $ US | 220 000 $ US |
| 1973 | 2 000 000 $ US | 440 000 $ US |
| 1972 | 500 000 $ US | 410 000 $ US |
| 1971 | 1 700 000 $ US | - |
| 1970 | 60 000 $ US | 100 000 $ US |
En 2025, les entrées nettes d'investissements directs étrangers étaient de 967 millions de dollars au Rwanda et de 35,1 millions de dollars au Burundi : 28 fois plus au Rwanda. En 1970, elles étaient de 60 000 dollars au Rwanda et de 100 000 dollars au Burundi.
Les entrées nettes d'investissements directs étrangers au Rwanda ont été supérieures à celles du Burundi pendant 47 des 50 années de 1970 à 2025 que les deux pays ont communiquées, et inférieures pendant 3.
Rwanda vs Burundi : dernières entrées et sorties d'investissements étrangers
|
Rwanda
|
Burundi
|
|
|---|---|---|
| Entrées nettes | +967 M $US | +35,1 M $US |
| Entrées nettes, % du PIB | +5,9 % | +1,0 % |
| Sorties nettes | +13,7 M $US | +3,90 M $US |
| Entrées nettes, total 2016–2025 | +3,87 Md $US | +274 M $US |
| Rang mondial | 93/192 | 158/192 |
Comparer les investissements directs étrangers de 2 pays au choix
Sources :
- Banque mondiale | Secteur financier (1970–2025, mis à jour en octobre 2026)
Creative Commons Attribution (CC BY) : vous pouvez copier, partager, adapter et réutiliser ce contenu, y compris à des fins commerciales, à condition de citer statistics.wiki et d’indiquer les modifications apportées. Les sources citées ci-dessus peuvent avoir leurs propres conditions de licence.