
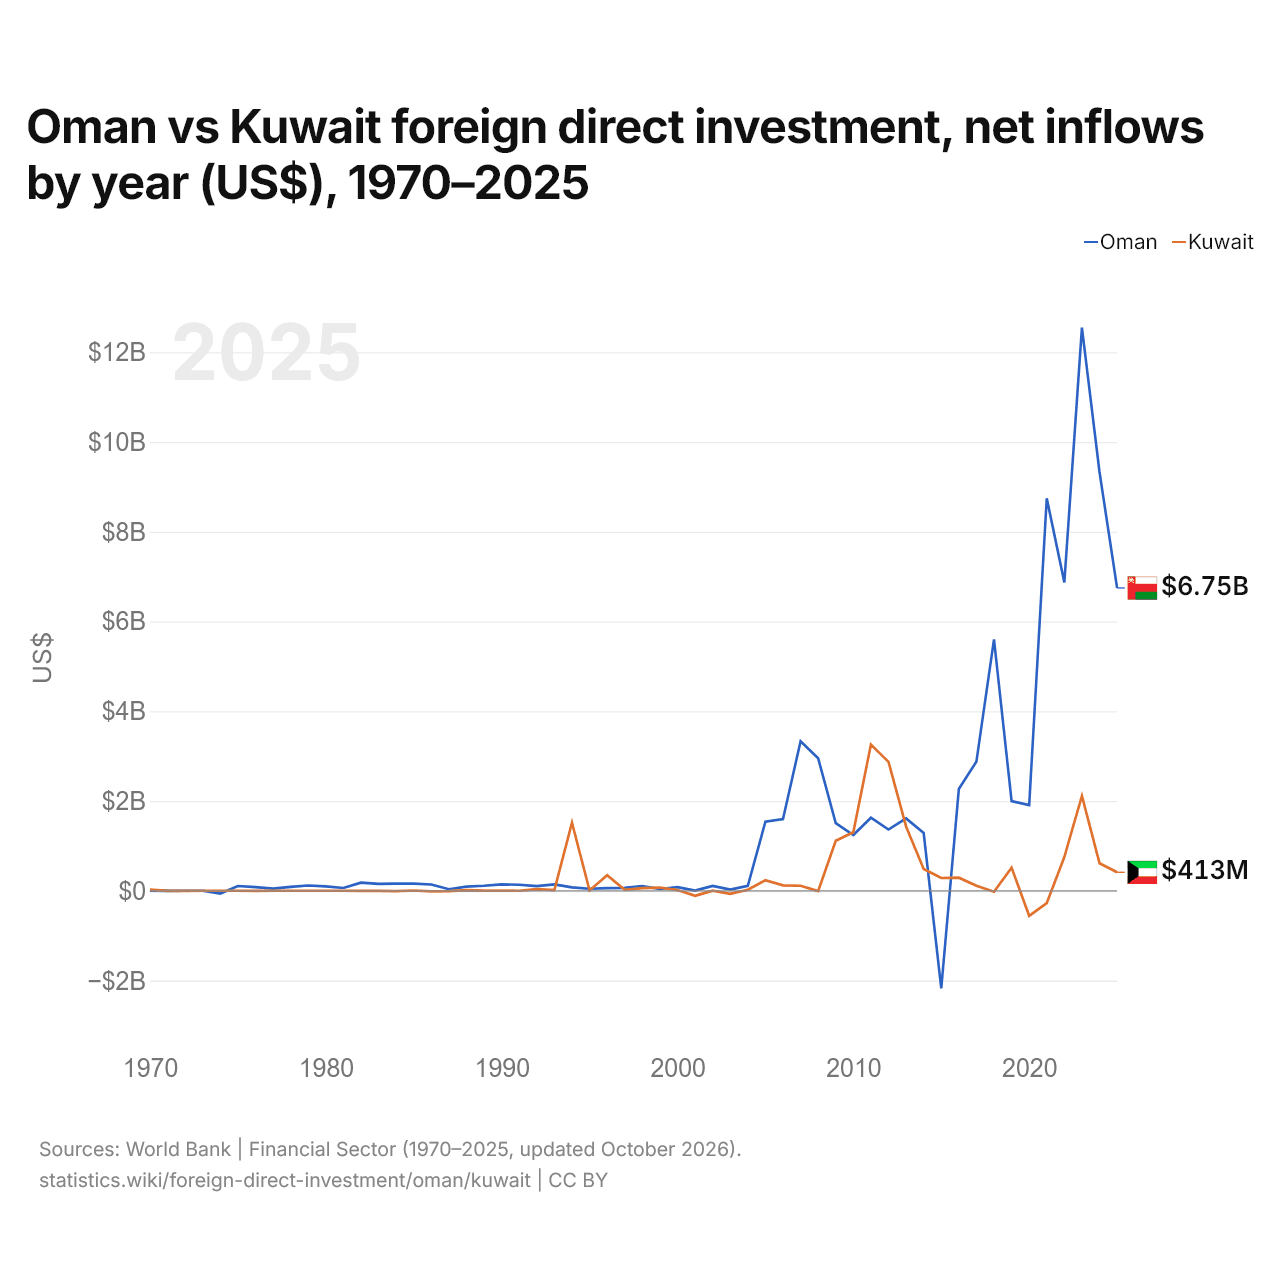
Oman vs Koweït : investissements directs étrangers, entrées nettes par année ($ US), 1970–2025
| Année | $ US | |
|---|---|---|
 Oman |
 Koweït |
|
| 2025 | 6 747 204 161 $ US | 413 089 669 $ US |
| 2024 | 9 330 559 168 $ US | 614 580 246 $ US |
| 2023 | 12 545 383 615 $ US | 2 114 603 345 $ US |
| 2022 | 6 871 781 534 $ US | 752 255 306 $ US |
| 2021 | 8 745 643 693 $ US | −272 335 307 $ US |
| 2020 | 1 909 492 848 $ US | −558 055 523 $ US |
| 2019 | 1 998 179 454 $ US | 515 617 569 $ US |
| 2018 | 5 600 780 234 $ US | −21 377 569 $ US |
| 2017 | 2 878 543 563 $ US | 113 012 065 $ US |
| 2016 | 2 266 070 221 $ US | 292 026 510 $ US |
| 2015 | −2 172 431 730 $ US | 284 647 624 $ US |
| 2014 | 1 286 345 904 $ US | 485 806 658 $ US |
| 2013 | 1 612 430 962 $ US | 1 433 630 444 $ US |
| 2012 | 1 364 629 389 $ US | 2 872 588 962 $ US |
| 2011 | 1 629 144 343 $ US | 3 259 067 552 $ US |
| 2010 | 1 242 652 796 $ US | 1 304 627 500 $ US |
| 2009 | 1 509 232 770 $ US | 1 113 588 047 $ US |
| 2008 | 2 951 885 566 $ US | −5 951 753 $ US |
| 2007 | 3 332 119 636 $ US | 111 535 690 $ US |
| 2006 | 1 596 098 830 $ US | 121 305 596 $ US |
| 2005 | 1 538 361 508 $ US | 233 904 110 $ US |
| 2004 | 111 053 316 $ US | 23 752 969 $ US |
| 2003 | 24 967 490 $ US | −67 111 499 $ US |
| 2002 | 109 232 770 $ US | 3 619 442 $ US |
| 2001 | 5 201 560 $ US | −111 516 285 $ US |
| 2000 | 82 000 000 $ US | 16 299 834 $ US |
| 1999 | 40 100 000 $ US | 72 269 842 $ US |
| 1998 | 101 999 999 $ US | 59 063 714 $ US |
| 1997 | 64 499 999 $ US | 19 779 209 $ US |
| 1996 | 60 599 999 $ US | 347 351 455 $ US |
| 1995 | 46 293 888 $ US | 6 701 341 $ US |
| 1994 | 76 462 939 $ US | 1 519 181 869 $ US |
| 1993 | 142 002 601 $ US | 13 252 098 $ US |
| 1992 | 104 291 287 $ US | 35 300 000 $ US |
| 1991 | 135 240 572 $ US | 800 000 $ US |
| 1990 | 142 262 679 $ US | 5 600 000 $ US |
| 1989 | 112 353 706 $ US | 3 660 000 $ US |
| 1988 | 91 807 542 $ US | 16 320 000 $ US |
| 1987 | 34 850 455 $ US | −6 320 000 $ US |
| 1986 | 140 320 779 $ US | −14 530 000 $ US |
| 1985 | 161 264 639 $ US | 7 250 000 $ US |
| 1984 | 158 078 736 $ US | −6 030 000 $ US |
| 1983 | 154 603 359 $ US | 40 000 $ US |
| 1982 | 182 107 702 $ US | −90 000 $ US |
| 1981 | 62 536 190 $ US | 1 210 000 $ US |
| 1980 | 98 436 596 $ US | 830 000 $ US |
| 1979 | 117 544 876 $ US | 1 280 000 $ US |
| 1978 | 86 276 781 $ US | 760 000 $ US |
| 1977 | 48 060 220 $ US | 1 330 000 $ US |
| 1976 | 81 354 951 $ US | −510 000 $ US |
| 1975 | 106 253 619 $ US | 250 000 $ US |
| 1974 | −61 088 593 $ US | 120 000 $ US |
| 1973 | 1 486 667 $ US | 300 000 $ US |
| 1972 | 1 710 000 $ US | 10 000 $ US |
| 1971 | −270 000 $ US | 10 000 $ US |
| 1970 | 3 020 000 $ US | 25 990 000 $ US |
En 2025, les entrées nettes d'investissements directs étrangers étaient de 6,75 milliards de dollars à Oman et de 413 millions de dollars au Koweït : 16 fois plus à Oman. En 1970, elles étaient de 3,02 millions de dollars à Oman et de 26 millions de dollars au Koweït.
Les entrées nettes d'investissements directs étrangers à Oman ont été supérieures à celles du Koweït pendant 46 des 56 années de 1970 à 2025, et inférieures pendant 10.
Oman vs Koweït : dernières entrées et sorties d'investissements étrangers
|
Oman
|
Koweït
|
|
|---|---|---|
| Entrées nettes | +6,75 Md $US | +413 M $US |
| Entrées nettes, % du PIB | +6,2 % | +0,3 % |
| Sorties nettes | −148 M $US | +2,99 Md $US |
| Entrées nettes, total 2016–2025 | +58,9 Md $US | +3,96 Md $US |
| Rang mondial | 42/192 | 119/192 |
Comparer les investissements directs étrangers de 2 pays au choix
Sources :
- Banque mondiale | Secteur financier (1970–2025, mis à jour en octobre 2026)
Creative Commons Attribution (CC BY) : vous pouvez copier, partager, adapter et réutiliser ce contenu, y compris à des fins commerciales, à condition de citer statistics.wiki et d’indiquer les modifications apportées. Les sources citées ci-dessus peuvent avoir leurs propres conditions de licence.