
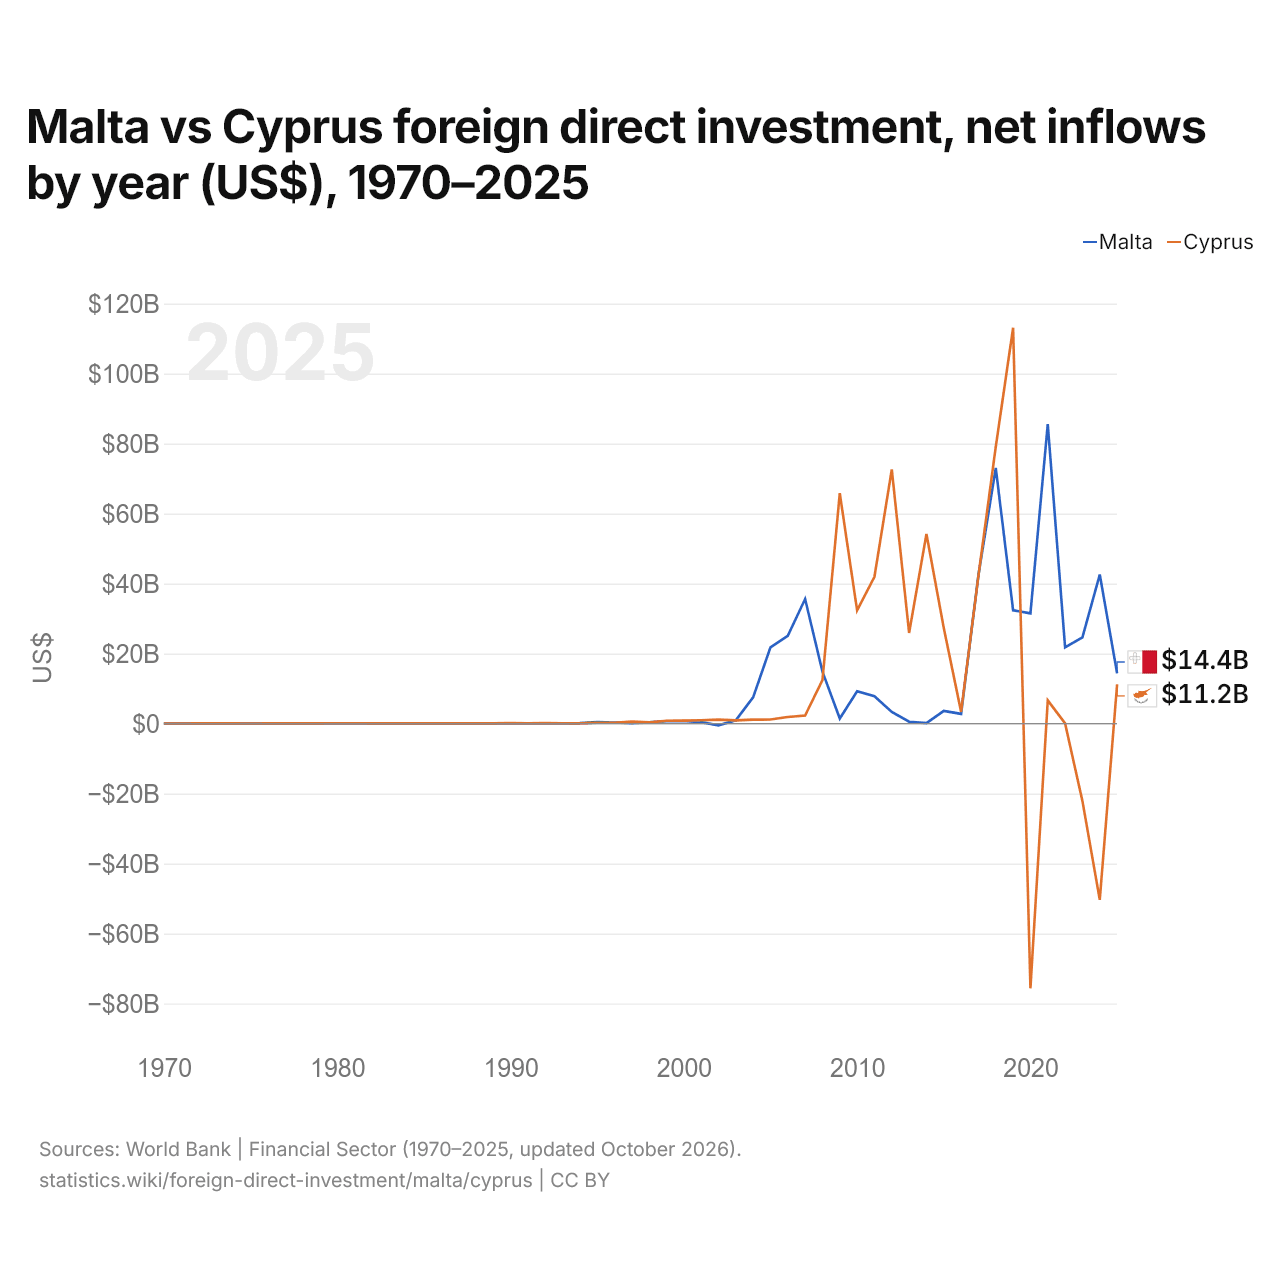
Malte vs Chypre : investissements directs étrangers, entrées nettes par année ($ US), 1970–2025
| Année | $ US | |
|---|---|---|
 Malte |
 Chypre |
|
| 2025 | 14 360 354 761 $ US | 11 163 058 901 $ US |
| 2024 | 42 586 013 467 $ US | −50 364 142 878 $ US |
| 2023 | 24 601 713 594 $ US | −22 151 767 933 $ US |
| 2022 | 21 777 714 703 $ US | 53 889 707 $ US |
| 2021 | 85 551 145 633 $ US | 6 626 435 042 $ US |
| 2020 | 31 484 121 889 $ US | −75 646 450 885 $ US |
| 2019 | 32 381 439 863 $ US | 113 114 188 087 $ US |
| 2018 | 73 050 789 630 $ US | 79 087 120 911 $ US |
| 2017 | 42 459 309 426 $ US | 42 234 145 948 $ US |
| 2016 | 2 776 034 108 $ US | 3 331 071 356 $ US |
| 2015 | 3 640 705 147 $ US | 27 319 647 777 $ US |
| 2014 | 155 878 728 $ US | 54 154 887 264 $ US |
| 2013 | 510 057 778 $ US | 25 898 129 367 $ US |
| 2012 | 3 323 599 815 $ US | 72 602 027 644 $ US |
| 2011 | 7 806 911 230 $ US | 41 942 439 662 $ US |
| 2010 | 9 244 998 120 $ US | 32 320 291 309 $ US |
| 2009 | 1 444 871 046 $ US | 65 815 356 285 $ US |
| 2008 | 14 837 770 104 $ US | 12 403 669 190 $ US |
| 2007 | 35 591 477 412 $ US | 2 294 635 571 $ US |
| 2006 | 25 035 392 674 $ US | 1 871 897 927 $ US |
| 2005 | 21 801 420 447 $ US | 1 161 973 511 $ US |
| 2004 | 7 469 040 205 $ US | 1 118 841 809 $ US |
| 2003 | 911 474 591 $ US | 908 147 518 $ US |
| 2002 | −497 796 508 $ US | 1 103 449 726 $ US |
| 2001 | 416 889 166 $ US | 944 742 874 $ US |
| 2000 | 743 185 325 $ US | 854 874 286 $ US |
| 1999 | 667 032 818 $ US | 813 054 280 $ US |
| 1998 | 323 284 766 $ US | 345 398 143 $ US |
| 1997 | 136 993 957 $ US | 546 519 215 $ US |
| 1996 | 312 996 147 $ US | 233 749 454 $ US |
| 1995 | 392 188 547 $ US | 243 136 819 $ US |
| 1994 | 151 693 045 $ US | 75 174 069 $ US |
| 1993 | 56 441 543 $ US | 83 432 989 $ US |
| 1992 | 84 694 336 $ US | 107 441 113 $ US |
| 1991 | 90 037 665 $ US | 81 820 991 $ US |
| 1990 | 30 019 824 $ US | 126 615 461 $ US |
| 1989 | 51 651 040 $ US | 69 749 822 $ US |
| 1988 | 40 803 168 $ US | 62 147 896 $ US |
| 1987 | 19 392 653 $ US | 51 964 618 $ US |
| 1986 | 21 883 369 $ US | 46 319 252 $ US |
| 1985 | 18 970 276 $ US | 57 954 234 $ US |
| 1984 | 26 245 343 $ US | 52 686 514 $ US |
| 1983 | 24 511 552 $ US | 68 357 791 $ US |
| 1982 | 20 866 569 $ US | 71 520 843 $ US |
| 1981 | 39 048 274 $ US | 78 304 678 $ US |
| 1980 | 26 633 728 $ US | 84 973 394 $ US |
| 1979 | 16 179 876 $ US | 70 533 031 $ US |
| 1978 | 21 536 998 $ US | 57 026 191 $ US |
| 1977 | 18 469 881 $ US | 41 409 229 $ US |
| 1976 | 14 113 136 $ US | 32 399 853 $ US |
| 1975 | 15 853 078 $ US | 18 100 000 $ US |
| 1974 | 10 636 044 $ US | 32 400 000 $ US |
| 1973 | 5 151 890 $ US | 37 200 000 $ US |
| 1972 | 4 455 199 $ US | 36 400 000 $ US |
| 1971 | 11 544 861 $ US | 29 600 000 $ US |
| 1970 | 11 600 000 $ US | 20 200 000 $ US |
En 2025, les entrées nettes d'investissements directs étrangers étaient de 14,4 milliards de dollars à Malte et de 11,2 milliards de dollars à Chypre : 29 % de plus à Malte. En 1970, elles étaient de 11,6 millions de dollars à Malte et de 20,2 millions de dollars à Chypre.
Les entrées nettes d'investissements directs étrangers à Malte ont été supérieures à celles de Chypre pendant 17 des 56 années de 1970 à 2025, et inférieures pendant 39.
Malte vs Chypre : dernières entrées et sorties d'investissements étrangers
|
Malte
|
Chypre
|
|
|---|---|---|
| Entrées nettes | +14,4 Md $US | +11,2 Md $US |
| Entrées nettes, % du PIB | +51,7 % | +27,1 % |
| Sorties nettes | +11,4 Md $US | +1,57 Md $US |
| Entrées nettes, total 2016–2025 | +371 Md $US | +107 Md $US |
| Rang mondial | 29/192 | 34/192 |
Comparer les investissements directs étrangers de 2 pays au choix
Sources :
- Banque mondiale | Secteur financier (1970–2025, mis à jour en octobre 2026)
Creative Commons Attribution (CC BY) : vous pouvez copier, partager, adapter et réutiliser ce contenu, y compris à des fins commerciales, à condition de citer statistics.wiki et d’indiquer les modifications apportées. Les sources citées ci-dessus peuvent avoir leurs propres conditions de licence.