
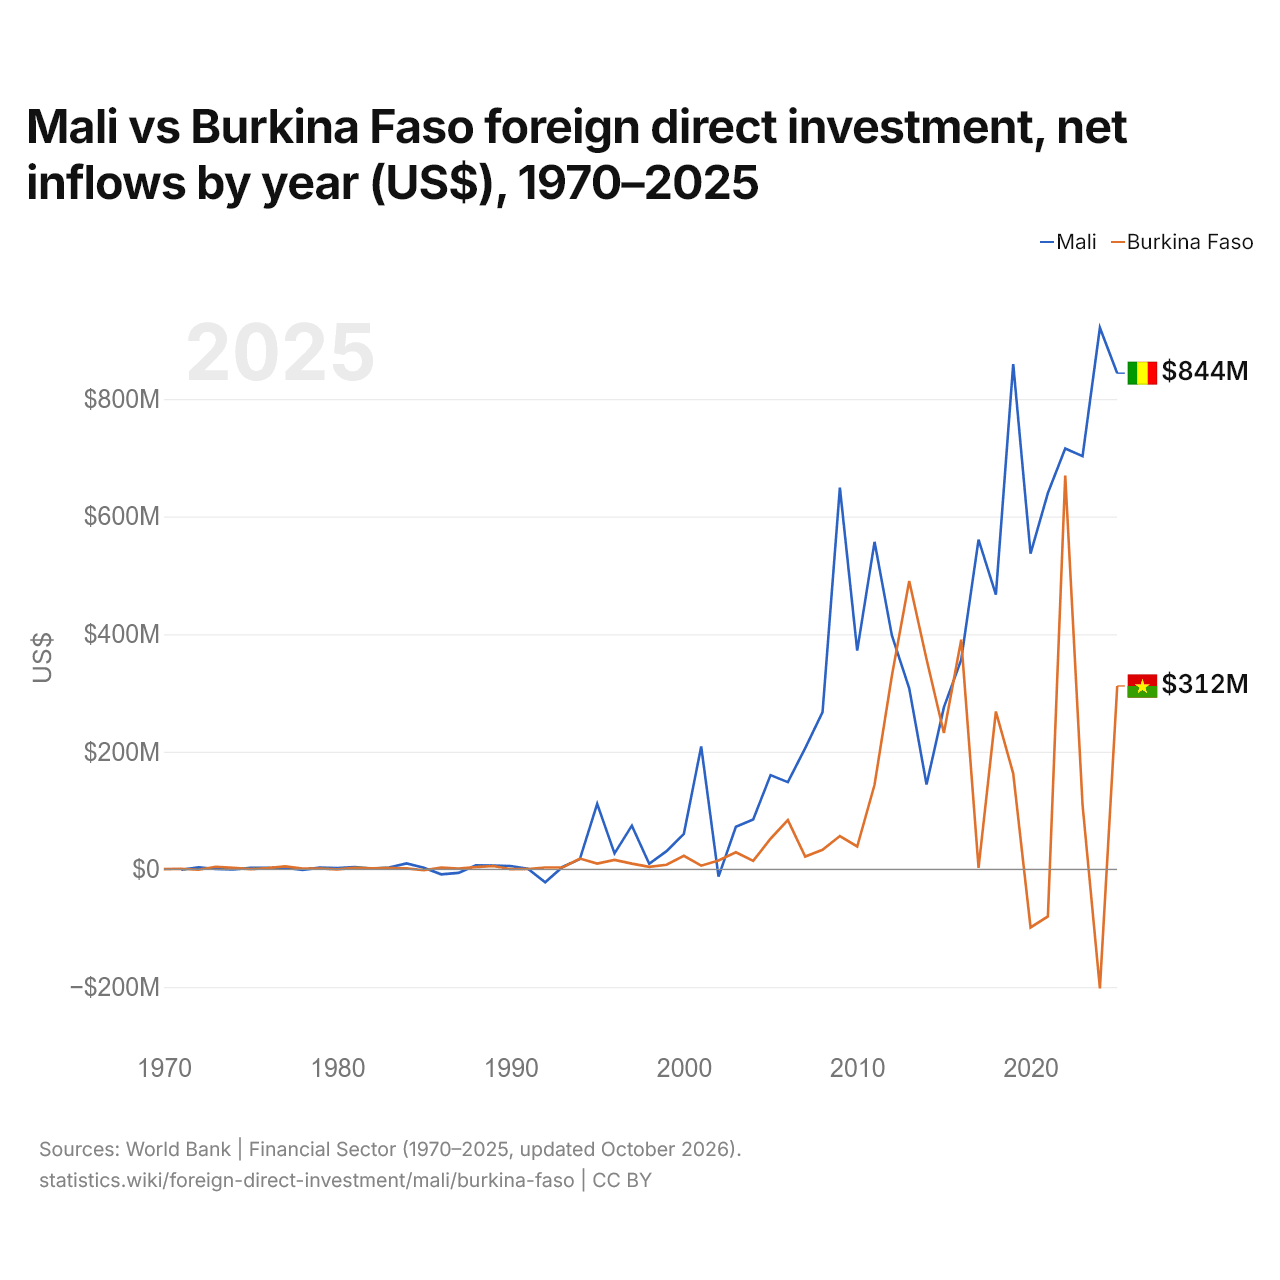
Mali vs Burkina Faso : investissements directs étrangers, entrées nettes par année ($ US), 1970–2025
| Année | $ US | |
|---|---|---|
 Mali |
 Burkina Faso |
|
| 2025 | 843 747 214 $ US | 311 876 091 $ US |
| 2024 | 921 044 498 $ US | −202 224 388 $ US |
| 2023 | 702 559 730 $ US | 109 438 755 $ US |
| 2022 | 715 469 995 $ US | 669 738 241 $ US |
| 2021 | 639 944 165 $ US | −79 957 355 $ US |
| 2020 | 536 851 813 $ US | −98 777 856 $ US |
| 2019 | 859 091 549 $ US | 162 970 140 $ US |
| 2018 | 467 295 391 $ US | 268 414 908 $ US |
| 2017 | 560 747 464 $ US | 2 572 690 $ US |
| 2016 | 356 476 592 $ US | 390 622 353 $ US |
| 2015 | 275 525 536 $ US | 231 901 704 $ US |
| 2014 | 144 214 831 $ US | 357 296 974 $ US |
| 2013 | 307 940 911 $ US | 490 403 411 $ US |
| 2012 | 397 842 480 $ US | 329 281 976 $ US |
| 2011 | 556 875 895 $ US | 143 845 512 $ US |
| 2010 | 371 932 365 $ US | 38 870 701 $ US |
| 2009 | 649 211 715 $ US | 56 653 992 $ US |
| 2008 | 267 511 186 $ US | 33 190 580 $ US |
| 2007 | 206 337 323 $ US | 21 711 801 $ US |
| 2006 | 148 327 334 $ US | 83 849 256 $ US |
| 2005 | 160 281 953 $ US | 52 130 041 $ US |
| 2004 | 84 992 922 $ US | 14 348 316 $ US |
| 2003 | 72 517 997 $ US | 29 122 505 $ US |
| 2002 | −12 371 106 $ US | 15 026 084 $ US |
| 2001 | 208 998 474 $ US | 6 267 061 $ US |
| 2000 | 60 331 623 $ US | 23 107 520 $ US |
| 1999 | 30 998 905 $ US | 7 925 951 $ US |
| 1998 | 9 556 713 $ US | 4 407 138 $ US |
| 1997 | 74 360 592 $ US | 9 765 809 $ US |
| 1996 | 27 209 332 $ US | 16 225 134 $ US |
| 1995 | 111 429 781 $ US | 9 816 728 $ US |
| 1994 | 17 417 000 $ US | 18 371 592 $ US |
| 1993 | 4 061 271 $ US | 3 178 381 $ US |
| 1992 | −21 874 497 $ US | 3 113 052 $ US |
| 1991 | 1 205 217 $ US | 570 000 $ US |
| 1990 | 5 729 716 $ US | 460 000 $ US |
| 1989 | 6 363 471 $ US | 5 670 000 $ US |
| 1988 | 7 050 571 $ US | 3 710 000 $ US |
| 1987 | −5 989 288 $ US | 1 330 000 $ US |
| 1986 | −8 374 099 $ US | 3 140 000 $ US |
| 1985 | 2 893 628 $ US | −1 430 000 $ US |
| 1984 | 10 069 648 $ US | 1 670 000 $ US |
| 1983 | 3 149 060 $ US | 1 980 000 $ US |
| 1982 | 1 521 578 $ US | 1 950 000 $ US |
| 1981 | 3 680 104 $ US | 2 430 000 $ US |
| 1980 | 2 366 533 $ US | 20 000 $ US |
| 1979 | 3 060 000 $ US | 1 490 000 $ US |
| 1978 | −886 305 $ US | 1 160 000 $ US |
| 1977 | 3 052 755 $ US | 4 970 000 $ US |
| 1976 | 2 573 755 $ US | 2 050 000 $ US |
| 1975 | 2 613 002 $ US | 300 000 $ US |
| 1974 | −150 000 $ US | 2 670 000 $ US |
| 1973 | 600 000 $ US | 4 400 000 $ US |
| 1972 | 3 400 000 $ US | −700 000 $ US |
| 1971 | −600 000 $ US | 1 000 000 $ US |
| 1970 | - | 400 000 $ US |
En 2025, les entrées nettes d'investissements directs étrangers étaient de 844 millions de dollars au Mali et de 312 millions de dollars au Burkina Faso : 2,7 fois plus au Mali. En 1971, elles étaient négatives au Mali, 600 000 dollars et de 1 million de dollars au Burkina Faso.
Les entrées nettes d'investissements directs étrangers au Mali ont été supérieures à celles du Burkina Faso pendant 41 des 55 années de 1971 à 2025, et inférieures pendant 14.
Mali vs Burkina Faso : dernières entrées et sorties d'investissements étrangers
|
Mali
|
Burkina Faso
|
|
|---|---|---|
| Entrées nettes | +844 M $US | +312 M $US |
| Entrées nettes, % du PIB | +2,8 % | +1,1 % |
| Sorties nettes | +58,4 M $US | +30,4 M $US |
| Entrées nettes, total 2016–2025 | +6,60 Md $US | +1,53 Md $US |
| Rang mondial | 100/192 | 125/192 |
Comparer les investissements directs étrangers de 2 pays au choix
Sources :
- Banque mondiale | Secteur financier (1970–2025, mis à jour en octobre 2026)
Creative Commons Attribution (CC BY) : vous pouvez copier, partager, adapter et réutiliser ce contenu, y compris à des fins commerciales, à condition de citer statistics.wiki et d’indiquer les modifications apportées. Les sources citées ci-dessus peuvent avoir leurs propres conditions de licence.