
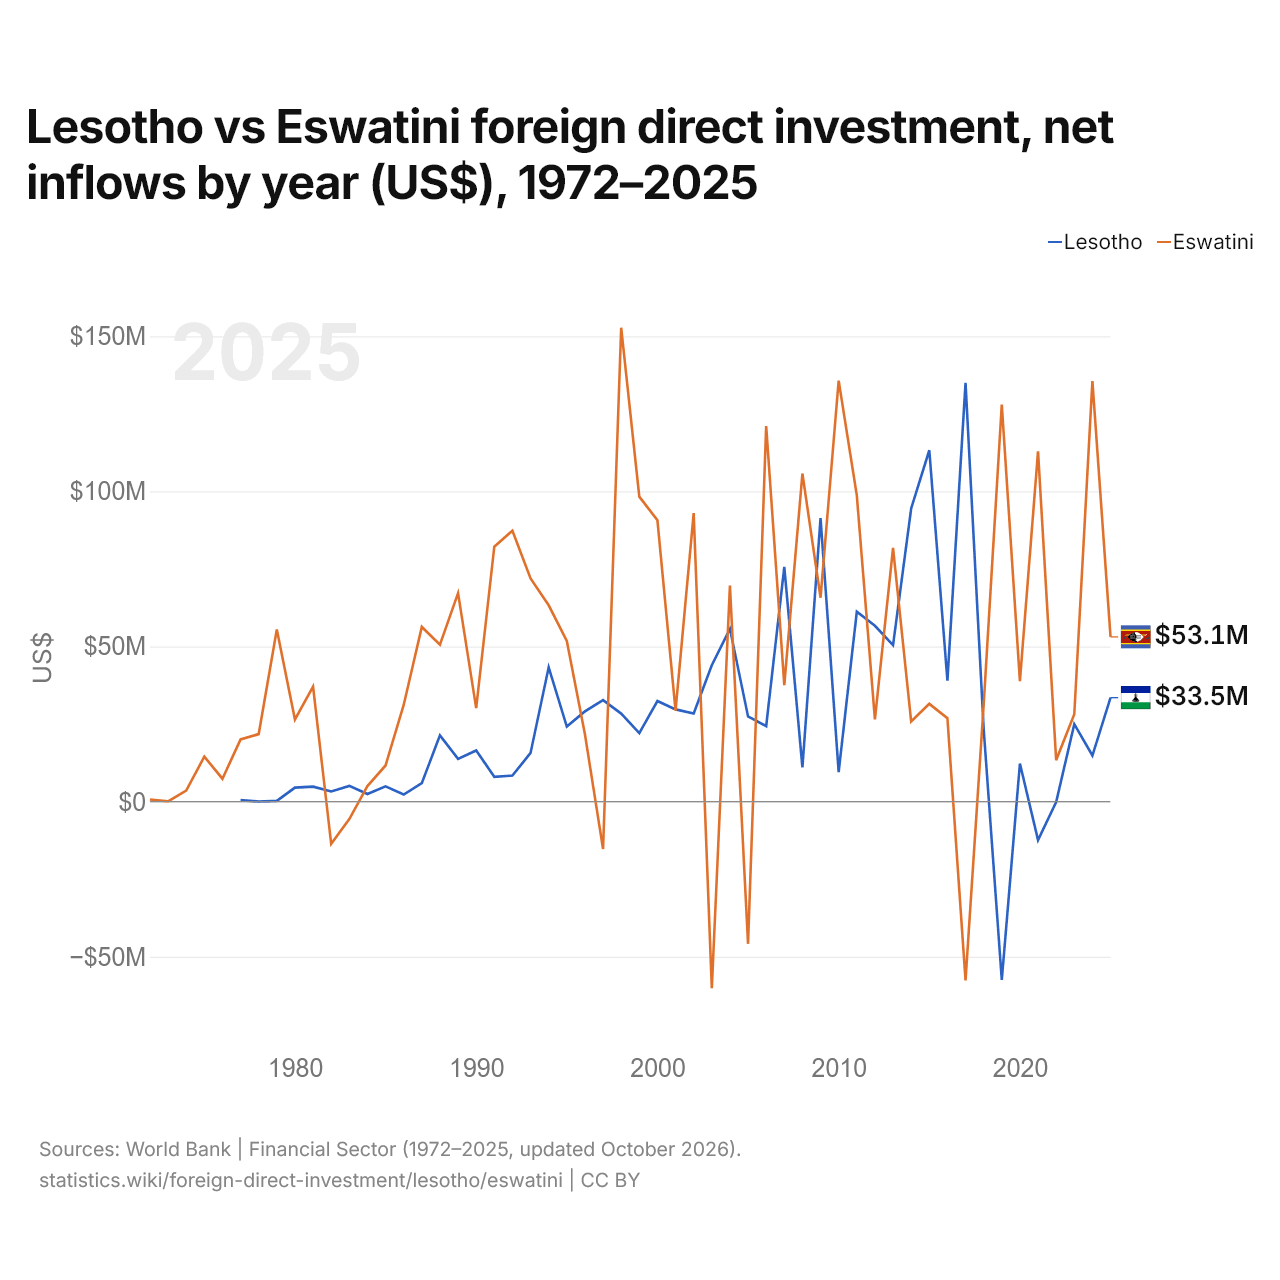
Lesotho vs Eswatini : investissements directs étrangers, entrées nettes par année ($ US), 1972–2025
| Année | $ US | |
|---|---|---|
 Lesotho |
 Eswatini |
|
| 2025 | 33 484 106 $ US | 53 066 234 $ US |
| 2024 | 14 823 065 $ US | 135 528 953 $ US |
| 2023 | 24 935 424 $ US | 28 132 551 $ US |
| 2022 | −138 752 $ US | 13 350 248 $ US |
| 2021 | −12 441 256 $ US | 112 865 288 $ US |
| 2020 | 12 262 632 $ US | 38 787 633 $ US |
| 2019 | −57 514 792 $ US | 127 970 922 $ US |
| 2018 | 23 460 238 $ US | 31 130 827 $ US |
| 2017 | 134 944 855 $ US | −57 647 593 $ US |
| 2016 | 38 951 410 $ US | 26 852 078 $ US |
| 2015 | 113 220 010 $ US | 31 498 094 $ US |
| 2014 | 94 460 147 $ US | 25 782 635 $ US |
| 2013 | 50 427 513 $ US | 81 790 158 $ US |
| 2012 | 56 652 703 $ US | 26 480 002 $ US |
| 2011 | 61 173 319 $ US | 98 708 322 $ US |
| 2010 | 9 508 669 $ US | 135 660 414 $ US |
| 2009 | 91 348 357 $ US | 65 705 860 $ US |
| 2008 | 11 009 973 $ US | 105 729 375 $ US |
| 2007 | 75 618 842 $ US | 37 493 846 $ US |
| 2006 | 24 322 287 $ US | 121 031 133 $ US |
| 2005 | 27 438 280 $ US | −45 850 345 $ US |
| 2004 | 55 671 431 $ US | 69 582 012 $ US |
| 2003 | 43 948 140 $ US | −60 190 680 $ US |
| 2002 | 28 391 255 $ US | 92 945 313 $ US |
| 2001 | 29 695 246 $ US | 29 330 084 $ US |
| 2000 | 32 403 928 $ US | 90 658 006 $ US |
| 1999 | 22 038 153 $ US | 98 270 490 $ US |
| 1998 | 28 350 687 $ US | 152 720 442 $ US |
| 1997 | 32 679 906 $ US | −15 313 929 $ US |
| 1996 | 29 073 625 $ US | 21 715 845 $ US |
| 1995 | 24 176 205 $ US | 51 756 162 $ US |
| 1994 | 43 269 332 $ US | 63 262 111 $ US |
| 1993 | 15 656 907 $ US | 71 920 620 $ US |
| 1992 | 8 369 827 $ US | 87 306 719 $ US |
| 1991 | 7 989 961 $ US | 82 134 780 $ US |
| 1990 | 16 478 707 $ US | 30 108 365 $ US |
| 1989 | 13 736 894 $ US | 67 183 251 $ US |
| 1988 | 21 346 471 $ US | 50 583 525 $ US |
| 1987 | 5 928 503 $ US | 56 285 915 $ US |
| 1986 | 2 254 226 $ US | 31 115 543 $ US |
| 1985 | 4 894 588 $ US | 11 621 255 $ US |
| 1984 | 2 414 764 $ US | 5 016 005 $ US |
| 1983 | 5 053 211 $ US | −5 654 789 $ US |
| 1982 | 3 242 231 $ US | −13 630 304 $ US |
| 1981 | 4 785 894 $ US | 37 033 705 $ US |
| 1980 | 4 493 899 $ US | 26 449 804 $ US |
| 1979 | 200 000 $ US | 55 461 694 $ US |
| 1978 | 20 000 $ US | 21 735 000 $ US |
| 1977 | 440 000 $ US | 20 010 000 $ US |
| 1976 | - | 7 360 000 $ US |
| 1975 | - | 14 469 084 $ US |
| 1974 | - | 3 532 128 $ US |
| 1973 | - | 60 000 $ US |
| 1972 | - | 670 000 $ US |
En 2025, les entrées nettes d'investissements directs étrangers étaient de 33,5 millions de dollars au Lesotho et de 53,1 millions de dollars en Eswatini : 1,6 fois plus en Eswatini. En 1977, elles étaient de 440 000 dollars au Lesotho et de 20 millions de dollars en Eswatini.
Les entrées nettes d'investissements directs étrangers au Lesotho ont été supérieures à celles de l'Eswatini pendant 14 des 49 années de 1977 à 2025, et inférieures pendant 35.
Lesotho vs Eswatini : dernières entrées et sorties d'investissements étrangers
|
Lesotho
|
Eswatini
|
|
|---|---|---|
| Entrées nettes | +33,5 M $US | +53,1 M $US |
| Entrées nettes, % du PIB | +1,3 % | +1,0 % |
| Sorties nettes | n.d. | −5,55 M $US (2025) |
| Entrées nettes, total 2016–2025 | +213 M $US | +510 M $US |
| Rang mondial | 160/192 | 152/192 |
Comparer les investissements directs étrangers de 2 pays au choix
Sources :
- Banque mondiale | Secteur financier (1972–2025, mis à jour en octobre 2026)
Creative Commons Attribution (CC BY) : vous pouvez copier, partager, adapter et réutiliser ce contenu, y compris à des fins commerciales, à condition de citer statistics.wiki et d’indiquer les modifications apportées. Les sources citées ci-dessus peuvent avoir leurs propres conditions de licence.