
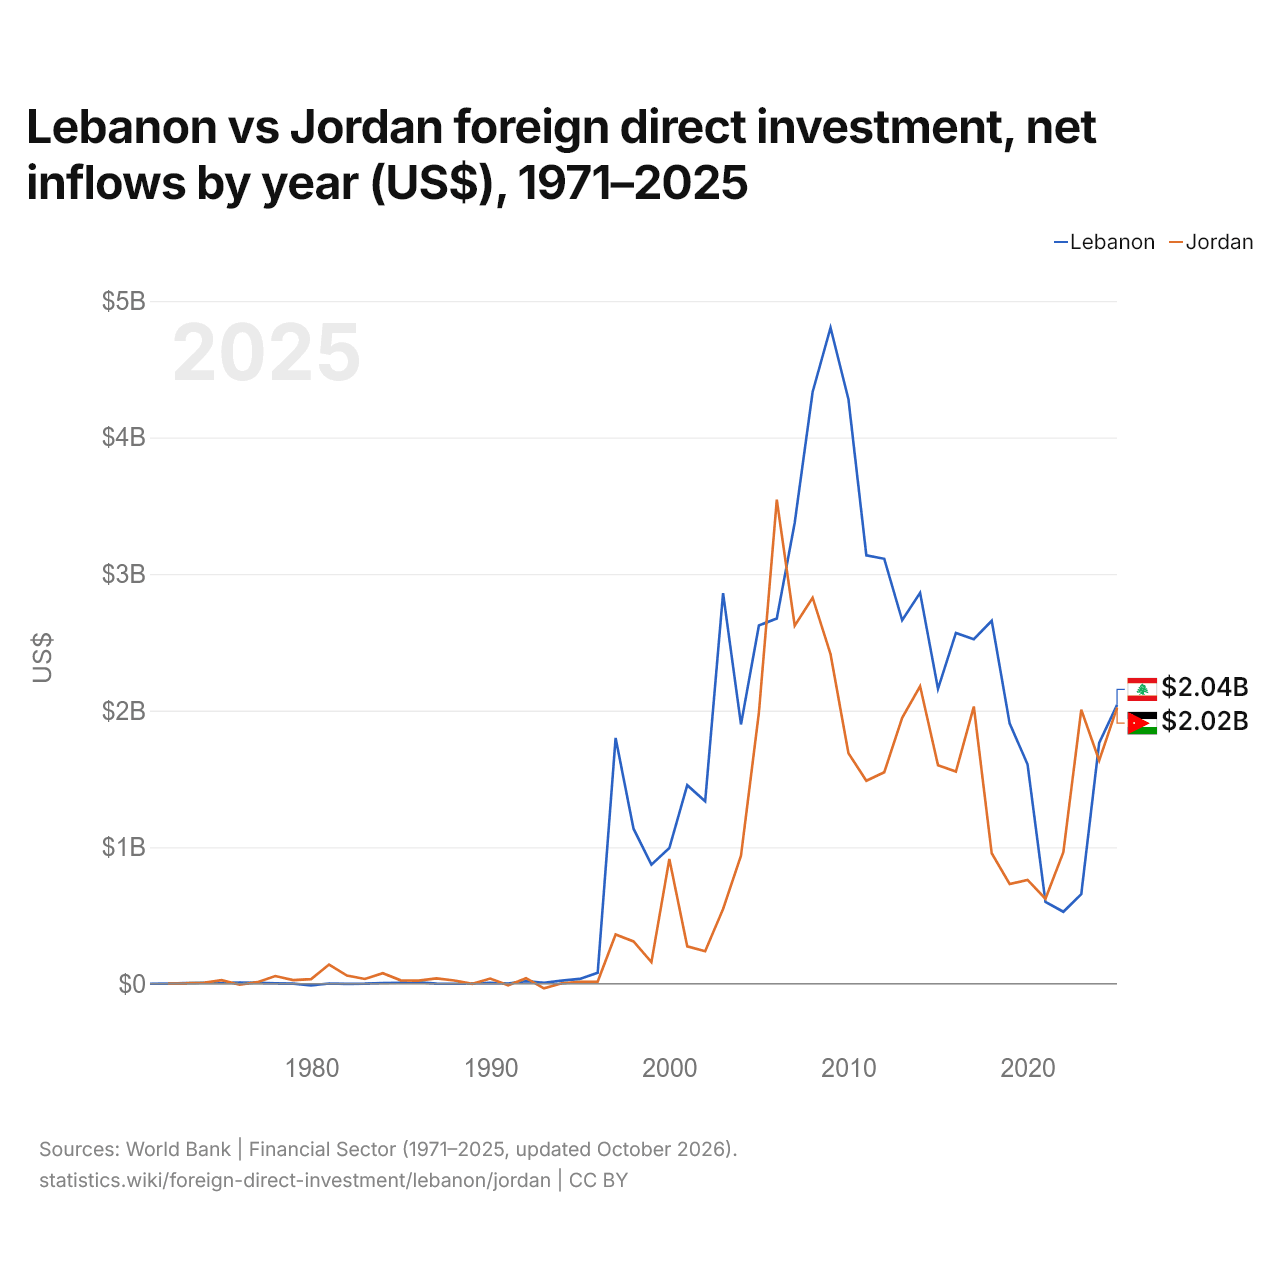
Liban vs Jordanie : investissements directs étrangers, entrées nettes par année ($ US), 1971–2025
| Année | $ US | |
|---|---|---|
 Liban |
 Jordanie |
|
| 2025 | 2 041 796 982 $ US | 2 021 971 831 $ US |
| 2024 | 1 764 118 831 $ US | 1 634 647 887 $ US |
| 2023 | 655 437 382 $ US | 2 006 338 028 $ US |
| 2022 | 526 838 754 $ US | 962 535 211 $ US |
| 2021 | 599 788 271 $ US | 621 830 986 $ US |
| 2020 | 1 606 894 722 $ US | 760 281 690 $ US |
| 2019 | 1 906 392 482 $ US | 729 718 310 $ US |
| 2018 | 2 658 003 845 $ US | 954 929 577 $ US |
| 2017 | 2 522 409 653 $ US | 2 029 718 310 $ US |
| 2016 | 2 568 485 071 $ US | 1 552 957 746 $ US |
| 2015 | 2 159 289 952 $ US | 1 600 281 690 $ US |
| 2014 | 2 862 509 427 $ US | 2 178 450 704 $ US |
| 2013 | 2 661 087 128 $ US | 1 946 597 204 $ US |
| 2012 | 3 111 315 000 $ US | 1 548 450 704 $ US |
| 2011 | 3 137 050 288 $ US | 1 486 056 338 $ US |
| 2010 | 4 279 880 835 $ US | 1 688 394 366 $ US |
| 2009 | 4 803 602 660 $ US | 2 413 098 592 $ US |
| 2008 | 4 333 045 470 $ US | 2 826 744 496 $ US |
| 2007 | 3 375 980 758 $ US | 2 622 144 779 $ US |
| 2006 | 2 674 534 372 $ US | 3 544 005 642 $ US |
| 2005 | 2 623 502 612 $ US | 1 984 485 190 $ US |
| 2004 | 1 898 780 570 $ US | 936 812 412 $ US |
| 2003 | 2 860 020 313 $ US | 546 967 560 $ US |
| 2002 | 1 335 970 000 $ US | 238 222 875 $ US |
| 2001 | 1 453 907 497 $ US | 273 628 171 $ US |
| 2000 | 993 475 429 $ US | 913 258 110 $ US |
| 1999 | 871 676 542 $ US | 157 968 970 $ US |
| 1998 | 1 134 903 121 $ US | 310 014 104 $ US |
| 1997 | 1 799 600 000 $ US | 360 930 889 $ US |
| 1996 | 80 000 000 $ US | 15 514 810 $ US |
| 1995 | 35 000 000 $ US | 13 308 089 $ US |
| 1994 | 22 560 000 $ US | 2 854 732 $ US |
| 1993 | 7 400 000 $ US | −33 548 530 $ US |
| 1992 | 18 460 000 $ US | 40 722 567 $ US |
| 1991 | 1 630 000 $ US | −11 887 398 $ US |
| 1990 | 6 450 000 $ US | 37 646 775 $ US |
| 1989 | 1 590 000 $ US | −1 349 805 $ US |
| 1988 | −270 000 $ US | 23 731 746 $ US |
| 1987 | 1 250 000 $ US | 39 498 588 $ US |
| 1986 | 10 480 000 $ US | 22 754 208 $ US |
| 1985 | 6 930 000 $ US | 24 948 927 $ US |
| 1984 | 5 070 000 $ US | 77 487 833 $ US |
| 1983 | 600 000 $ US | 34 864 662 $ US |
| 1982 | −670 000 $ US | 59 432 046 $ US |
| 1981 | 1 660 000 $ US | 140 813 772 $ US |
| 1980 | −12 160 000 $ US | 33 830 643 $ US |
| 1979 | 290 000 $ US | 26 371 066 $ US |
| 1978 | 2 230 000 $ US | 56 431 307 $ US |
| 1977 | 6 100 000 $ US | 11 230 237 $ US |
| 1976 | 7 490 000 $ US | −7 530 499 $ US |
| 1975 | 5 040 000 $ US | 25 641 694 $ US |
| 1974 | 6 340 000 $ US | 6 830 354 $ US |
| 1973 | 3 950 000 $ US | 2 130 438 $ US |
| 1972 | 760 000 $ US | 559 999 $ US |
| 1971 | −80 000 $ US | - |
En 2025, les entrées nettes d'investissements directs étrangers étaient de 2,04 milliards de dollars au Liban et de 2,02 milliards de dollars en Jordanie : 0,98 % de plus au Liban. En 1972, elles étaient de 760 000 dollars au Liban et de 560 000 dollars en Jordanie.
Les entrées nettes d'investissements directs étrangers au Liban ont été supérieures à celles de la Jordanie pendant 34 des 54 années de 1972 à 2025, et inférieures pendant 20.
Liban vs Jordanie : dernières entrées et sorties d'investissements étrangers
|
Liban
|
Jordanie
|
|
|---|---|---|
| Entrées nettes | +2,04 Md $US | +2,02 Md $US |
| Entrées nettes, % du PIB | n.d. | +3,3 % |
| Sorties nettes | +265 M $US | +97,9 M $US |
| Entrées nettes, total 2016–2025 | +16,9 Md $US | +13,3 Md $US |
| Rang mondial | 64/192 | 66/192 |
Comparer les investissements directs étrangers de 2 pays au choix
Sources :
- Banque mondiale | Secteur financier (1971–2025, mis à jour en octobre 2026)
Creative Commons Attribution (CC BY) : vous pouvez copier, partager, adapter et réutiliser ce contenu, y compris à des fins commerciales, à condition de citer statistics.wiki et d’indiquer les modifications apportées. Les sources citées ci-dessus peuvent avoir leurs propres conditions de licence.