
Graphique du taux de dépendance démographique du Guyana : total, 65 ans et plus et 0 à 14 ans, 1950–2100
| Année | Pour 100 personnes de 15 à 64 ans | Rang mondial | ||
|---|---|---|---|---|
| Total | 65 ans et plus | 0 à 14 ans | ||
| 2100 projection | 66,3 | 40 | 26,3 | #117 |
| 2099 projection | 66 | 39,6 | 26,4 | #118 |
| 2098 projection | 65,7 | 39,2 | 26,5 | #117 |
| 2097 projection | 65,4 | 38,8 | 26,5 | #117 |
| 2096 projection | 65 | 38,4 | 26,6 | #116 |
| 2095 projection | 64,7 | 38 | 26,7 | #117 |
| 2094 projection | 64,4 | 37,6 | 26,7 | #117 |
| 2093 projection | 64 | 37,2 | 26,8 | #117 |
| 2092 projection | 63,7 | 36,8 | 26,9 | #117 |
| 2091 projection | 63,3 | 36,3 | 27 | #118 |
| 2090 projection | 62,9 | 35,8 | 27 | #118 |
| 2089 projection | 62,5 | 35,3 | 27,1 | #118 |
| 2088 projection | 62 | 34,8 | 27,2 | #118 |
| 2087 projection | 61,5 | 34,2 | 27,3 | #118 |
| 2086 projection | 61 | 33,7 | 27,3 | #118 |
| 2085 projection | 60,4 | 33 | 27,4 | #119 |
| 2084 projection | 59,8 | 32,4 | 27,4 | #119 |
| 2083 projection | 59,3 | 31,8 | 27,5 | #120 |
| 2082 projection | 58,7 | 31,2 | 27,5 | #120 |
| 2081 projection | 58,2 | 30,6 | 27,6 | #120 |
| 2080 projection | 57,6 | 30 | 27,7 | #121 |
| 2079 projection | 57,1 | 29,4 | 27,7 | #120 |
| 2078 projection | 56,6 | 28,8 | 27,8 | #120 |
| 2077 projection | 56,1 | 28,2 | 27,9 | #122 |
| 2076 projection | 55,7 | 27,7 | 28 | #122 |
| 2075 projection | 55,3 | 27,2 | 28,1 | #123 |
| 2074 projection | 54,9 | 26,7 | 28,2 | #125 |
| 2073 projection | 54,6 | 26,3 | 28,3 | #127 |
| 2072 projection | 54,3 | 25,9 | 28,5 | #130 |
| 2071 projection | 54,2 | 25,5 | 28,6 | #130 |
| 2070 projection | 54,1 | 25,3 | 28,8 | #130 |
| 2069 projection | 54 | 25 | 29,1 | #128 |
| 2068 projection | 54 | 24,7 | 29,3 | #129 |
| 2067 projection | 53,8 | 24,3 | 29,5 | #132 |
| 2066 projection | 53,5 | 23,9 | 29,7 | #135 |
| 2065 projection | 53,2 | 23,3 | 29,9 | #139 |
| 2064 projection | 52,8 | 22,7 | 30,1 | #146 |
| 2063 projection | 52,3 | 22 | 30,2 | #153 |
| 2062 projection | 51,7 | 21,3 | 30,4 | #157 |
| 2061 projection | 51,2 | 20,6 | 30,6 | #166 |
| 2060 projection | 50,8 | 20 | 30,8 | #167 |
| 2059 projection | 50,4 | 19,3 | 31 | #170 |
| 2058 projection | 50 | 18,8 | 31,3 | #172 |
| 2057 projection | 49,8 | 18,3 | 31,5 | #172 |
| 2056 projection | 49,6 | 17,8 | 31,8 | #171 |
| 2055 projection | 49,5 | 17,5 | 32 | #173 |
| 2054 projection | 49,5 | 17,2 | 32,3 | #172 |
| 2053 projection | 49,7 | 17,1 | 32,6 | #170 |
| 2052 projection | 49,9 | 16,9 | 32,9 | #168 |
| 2051 projection | 50,1 | 16,8 | 33,2 | #165 |
| 2050 projection | 50,3 | 16,8 | 33,5 | #162 |
| 2049 projection | 50,5 | 16,7 | 33,8 | #159 |
| 2048 projection | 50,7 | 16,6 | 34,1 | #157 |
| 2047 projection | 51 | 16,5 | 34,4 | #153 |
| 2046 projection | 51,2 | 16,4 | 34,7 | #148 |
| 2045 projection | 51,3 | 16,3 | 35 | #146 |
| 2044 projection | 51,5 | 16,1 | 35,4 | #140 |
| 2043 projection | 51,7 | 16 | 35,7 | #138 |
| 2042 projection | 51,8 | 15,8 | 36,1 | #131 |
| 2041 projection | 52 | 15,6 | 36,4 | #127 |
| 2040 projection | 52,2 | 15,3 | 36,9 | #125 |
| 2039 projection | 52,4 | 15,1 | 37,3 | #122 |
| 2038 projection | 52,6 | 14,8 | 37,8 | #119 |
| 2037 projection | 53 | 14,6 | 38,4 | #117 |
| 2036 projection | 53,3 | 14,3 | 39 | #115 |
| 2035 projection | 53,6 | 14,1 | 39,6 | #110 |
| 2034 projection | 54,1 | 13,8 | 40,3 | #103 |
| 2033 projection | 54,4 | 13,5 | 40,9 | #103 |
| 2032 projection | 54,7 | 13,2 | 41,6 | #103 |
| 2031 projection | 55,1 | 12,8 | 42,2 | #101 |
| 2030 projection | 55,4 | 12,5 | 42,9 | #101 |
| 2029 projection | 55,7 | 12,2 | 43,5 | #97 |
| 2028 projection | 55,9 | 11,8 | 44,1 | #100 |
| 2027 projection | 56 | 11,5 | 44,5 | #94 |
| 2026 projection | 56,1 | 11,1 | 45 | #94 |
| 2025 projection | 56 | 10,7 | 45,3 | #94 |
| 2024 | 56 | 10,3 | 45,7 | #94 |
| 2023 | 55,6 | 9,9 | 45,7 | #96 |
| 2022 | 55,1 | 9,5 | 45,6 | #98 |
| 2021 | 55,1 | 9,4 | 45,7 | #97 |
| 2020 | 54,8 | 9,2 | 45,7 | #101 |
| 2019 | 53,1 | 8,7 | 44,4 | #110 |
| 2018 | 55,6 | 8,9 | 46,7 | #89 |
| 2017 | 55,3 | 8,6 | 46,7 | #87 |
| 2016 | 55,2 | 8,4 | 46,8 | #91 |
| 2015 | 55,3 | 8,1 | 47,1 | #90 |
| 2014 | 55,5 | 7,9 | 47,6 | #89 |
| 2013 | 55,9 | 7,7 | 48,2 | #87 |
| 2012 | 56,5 | 7,6 | 48,9 | #84 |
| 2011 | 57,6 | 7,4 | 50,3 | #83 |
| 2010 | 58,9 | 7,2 | 51,7 | #82 |
| 2009 | 60,3 | 7,1 | 53,2 | #80 |
| 2008 | 61,6 | 7 | 54,7 | #76 |
| 2007 | 63 | 6,9 | 56,1 | #76 |
| 2006 | 64,4 | 6,8 | 57,6 | #76 |
| 2005 | 65,6 | 6,7 | 58,9 | #75 |
| 2004 | 66,6 | 6,6 | 59,9 | #75 |
| 2003 | 67,3 | 6,6 | 60,7 | #77 |
| 2002 | 67,7 | 6,5 | 61,2 | #78 |
| 2001 | 67,9 | 6,5 | 61,4 | #83 |
| 2000 | 67,9 | 6,4 | 61,4 | #86 |
| 1999 | 67,8 | 6,4 | 61,4 | #90 |
| 1998 | 67,6 | 6,4 | 61,2 | #97 |
| 1997 | 67,5 | 6,4 | 61,1 | #100 |
| 1996 | 67,4 | 6,5 | 61 | #101 |
| 1995 | 67,4 | 6,5 | 60,9 | #105 |
| 1994 | 67,6 | 6,6 | 61 | #106 |
| 1993 | 67,9 | 6,6 | 61,2 | #106 |
| 1992 | 68,3 | 6,7 | 61,6 | #106 |
| 1991 | 68,8 | 6,7 | 62,1 | #106 |
| 1990 | 69,3 | 6,7 | 62,7 | #105 |
| 1989 | 70,2 | 6,7 | 63,5 | #105 |
| 1988 | 71,3 | 6,7 | 64,6 | #105 |
| 1987 | 72,7 | 6,7 | 66,1 | #103 |
| 1986 | 74,5 | 6,7 | 67,8 | #100 |
| 1985 | 76,4 | 6,7 | 69,7 | #96 |
| 1984 | 78,6 | 6,8 | 71,8 | #95 |
| 1983 | 80,9 | 6,9 | 74 | #92 |
| 1982 | 83,2 | 7 | 76,2 | #89 |
| 1981 | 85,5 | 7,1 | 78,4 | #81 |
| 1980 | 86,9 | 7,1 | 79,8 | #76 |
| 1979 | 88,5 | 7,1 | 81,4 | #72 |
| 1978 | 90,2 | 7,1 | 83 | #67 |
| 1977 | 91,8 | 7,1 | 84,7 | #60 |
| 1976 | 93,4 | 7,1 | 86,3 | #50 |
| 1975 | 95 | 7,1 | 87,9 | #48 |
| 1974 | 96,5 | 7,1 | 89,4 | #43 |
| 1973 | 97,9 | 7,2 | 90,7 | #42 |
| 1972 | 99,1 | 7,2 | 91,9 | #36 |
| 1971 | 100,4 | 7,3 | 93,1 | #33 |
| 1970 | 101,5 | 7,3 | 94,2 | #28 |
| 1969 | 102,9 | 7,3 | 95,6 | #25 |
| 1968 | 104,1 | 7,3 | 96,8 | #25 |
| 1967 | 104,9 | 7,3 | 97,6 | #20 |
| 1966 | 105,4 | 7,3 | 98,1 | #18 |
| 1965 | 105,4 | 7,3 | 98,2 | #17 |
| 1964 | 105 | 7,2 | 97,8 | #16 |
| 1963 | 104,2 | 7,2 | 97 | #15 |
| 1962 | 103 | 7,2 | 95,8 | #15 |
| 1961 | 101,5 | 7,1 | 94,4 | #17 |
| 1960 | 100,5 | 6,6 | 93,9 | #16 |
| 1959 | 99 | 6,6 | 92,4 | #19 |
| 1958 | 97,2 | 6,5 | 90,7 | #21 |
| 1957 | 95,2 | 6,5 | 88,7 | #28 |
| 1956 | 93,1 | 6,4 | 86,7 | #32 |
| 1955 | 91,1 | 6,5 | 84,7 | #37 |
| 1954 | 88,9 | 6,5 | 82,4 | #41 |
| 1953 | 87 | 6,6 | 80,4 | #45 |
| 1952 | 85,3 | 6,8 | 78,5 | #54 |
| 1951 | 83,7 | 7 | 76,7 | #63 |
| 1950 | 82,3 | 7,2 | 75 | #72 |
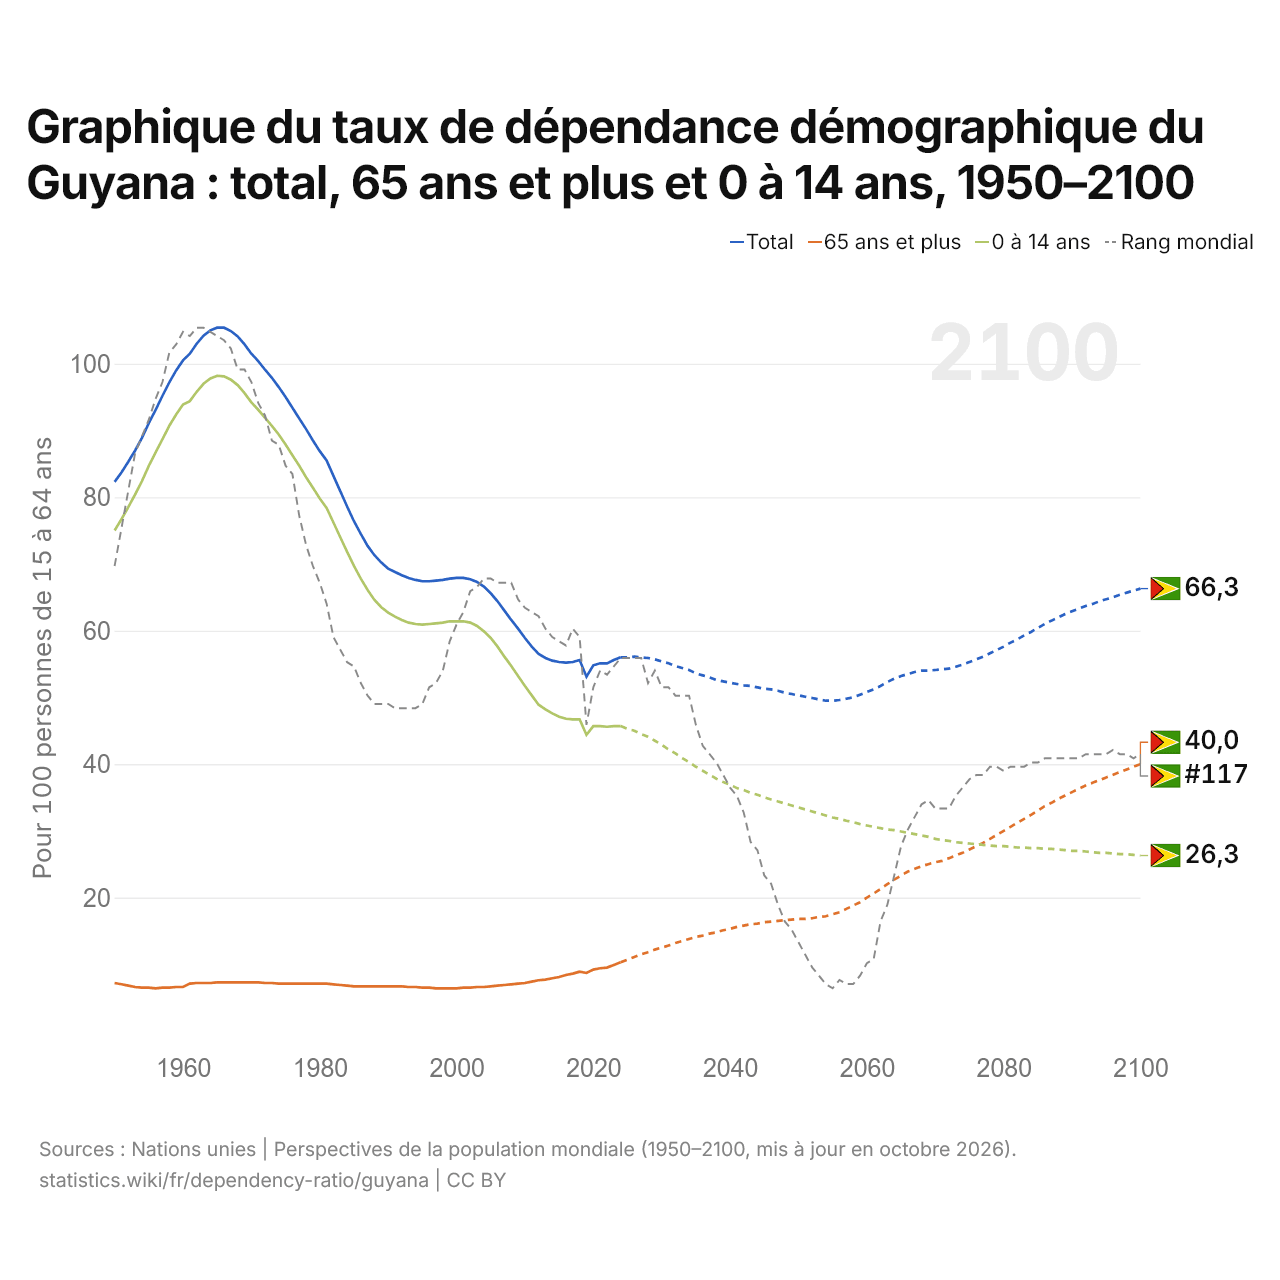
En 2026, on compte au Guyana 56,1 personnes de 0 à 14 ans ou de 65 ans et plus pour 100 personnes de 15 à 64 ans, contre 82,3 en 1950. Parmi elles, 45,0 sont des enfants de 0 à 14 ans et 11,1 des personnes de 65 ans et plus. Ce taux se classe au 94e rang mondial, un rang qu'il occupe depuis 2024. Son meilleur rang a été le 15e, occupé pour la dernière fois en 1963. Il a atteint son maximum, 105,4, en 1965, et selon les projections il montera à 66,3 en 2100.
Le taux de dépendance du Guyana est le plus élevé des 35 pays situés en Amérique latine, devant le Guatemala (55,7). Selon les projections, à partir de 2077, les personnes de 65 ans et plus seront plus nombreuses que les enfants de 0 à 14 ans au Guyana. En 2026, on compte au Guyana 9,0 personnes de 15 à 64 ans pour une personne de 65 ans et plus, contre 13,9 en 1950.
Taux de dépendance démographique du Guyana : personnes de 0 à 14 ans et de 65 ans et plus pour 100 personnes de 15 à 64 ans, 1950–2100
| Année | Total | 65 ans et plus | 0 à 14 ans | Personnes de 15 à 64 ans par personne de 65 ans et plus |
|---|---|---|---|---|
| 2100 projection | 66,3 | 40,0 | 26,3 | 2,5 |
| 2090 projection | 62,9 | 35,8 | 27,0 | 2,8 |
| 2080 projection | 57,6 | 30,0 | 27,7 | 3,3 |
| 2070 projection | 54,1 | 25,3 | 28,8 | 4,0 |
| 2060 projection | 50,8 | 20,0 | 30,8 | 5,0 |
| 2050 projection | 50,3 | 16,8 | 33,5 | 6,0 |
| 2040 projection | 52,2 | 15,3 | 36,9 | 6,5 |
| 2030 projection | 55,4 | 12,5 | 42,9 | 8,0 |
| 2026 projection | 56,1 | 11,1 | 45,0 | 9,0 |
| 2020 | 54,8 | 9,2 | 45,7 | 10,9 |
| 2010 | 58,9 | 7,2 | 51,7 | 13,9 |
| 2000 | 67,9 | 6,4 | 61,4 | 15,5 |
| 1990 | 69,3 | 6,7 | 62,7 | 15,0 |
| 1980 | 86,9 | 7,1 | 79,8 | 14,1 |
| 1970 | 101,5 | 7,3 | 94,2 | 13,8 |
| 1960 | 100,5 | 6,6 | 93,9 | 15,0 |
| 1950 | 82,3 | 7,2 | 75,0 | 13,9 |
Comparer le taux de dépendance démographique du Guyana avec celui d'autres pays
Sources :
- Nations unies | Perspectives de la population mondiale (1950–2100, mis à jour en octobre 2026)
Creative Commons Attribution (CC BY) : vous pouvez copier, partager, adapter et réutiliser ce contenu, y compris à des fins commerciales, à condition de citer statistics.wiki et d’indiquer les modifications apportées. Les sources citées ci-dessus peuvent avoir leurs propres conditions de licence.